Disliked{quote} v1.24 - added "Draw in Background" options for all rectangles and trendlines {file} {file}Ignored
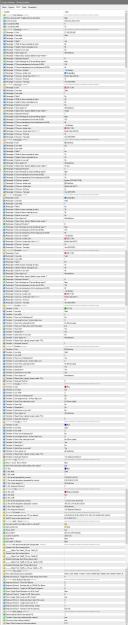
With the previous version I could manually edit the timeframe visualisation on the chart if I wanted to edit the visualisation of some "already drawn" lines.
But with the new version, the tick boxes automatically re-tick themselves after refreshing, reverting back to the default, therefore cant be adjusted.
If that makes sense.
Cheers