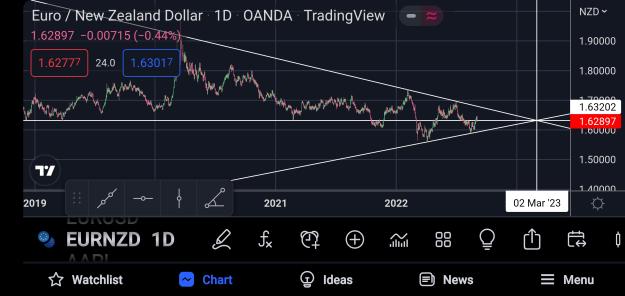
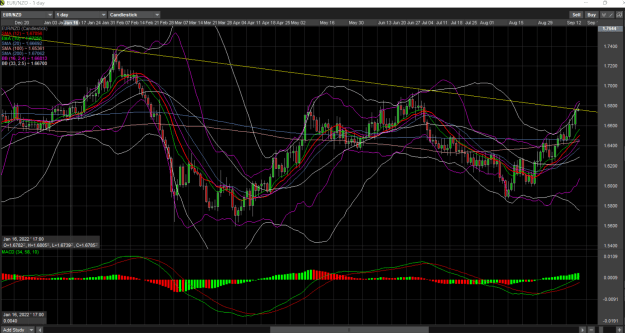
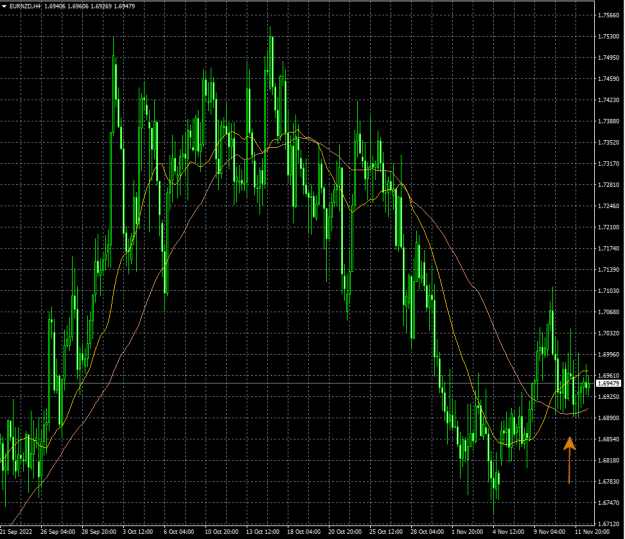
Let's see if it can make it past this longer term trendline. Technically, this pair is still structured to the downside long term, so this could be an area where sellers step in. However, if we get a weekly close above this line, we could easily see the 1.695 area before too long, and potentially a continued move up towards around 1.72 and beyond.
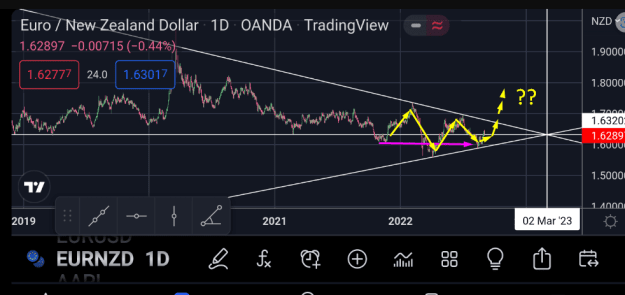
E/N currently sitting just a few pips away from a 2 year high. Next quarter should be interesting for this pair. I have a feeling things will begin getting interesting next week.
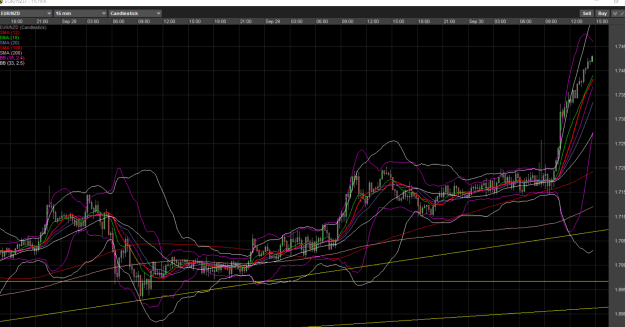
Nearly 300 pips straight up over the past few hours. Right now this is nothing more than a game of 'how high can it go until the clock runs out and the quarter closes?' Nothing more. Throw away your trendlines, throw away your fib levels, pivot points, or other areas of s/r. I think the only thing that can possibly stop this thing right now is time. More or less the same thing for g/n, g/a, and e/a right now as well.
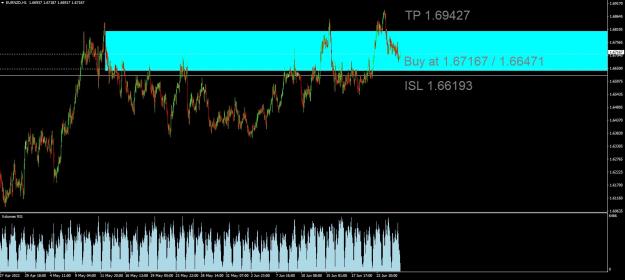
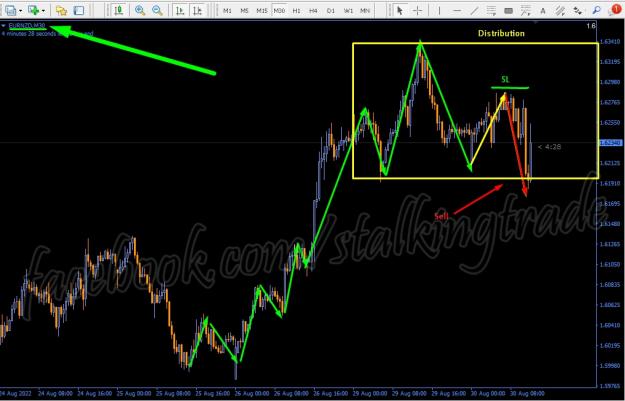
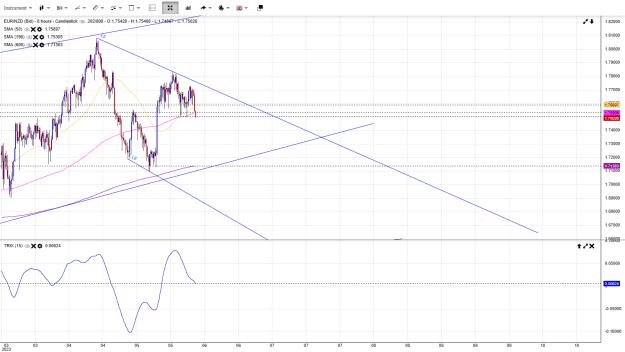
Euro New Zealand currency pair, which has recently been rejected from a strong resistance level and is moving down. This level has been tested multiple times during the month, and in the one-hour chart, we're now looking for a possible entry and a decent opportunity to get in. We've identified a configuration that has more than one name - it could be a double top, a false breakout, or a V pattern. Specifically, we're seeing that the price has settled down below the breakout candle in the one-hour chart, and we've taken our position below the lowest level of that breakout bar. We'll be discussing the significance of this pattern and what it could mean for the direction of the currency pair. Additionally, we'll be looking at the risk-reward ratio for this trade, which is 1:1.5.
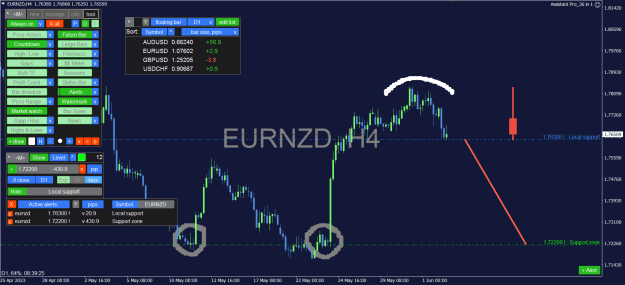
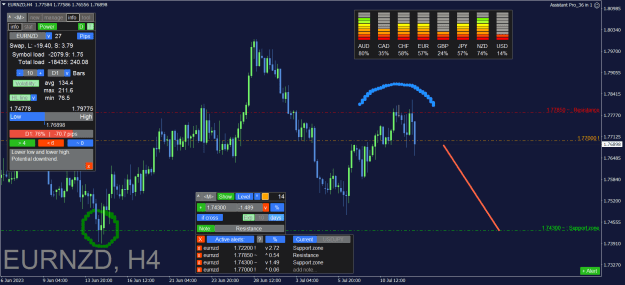
EUR/NZD (4H): the price may soon break the local support (1.755) and continue the overall downtrend towards the 1.722 support area. Lower low, lower high, Price Action pattern.
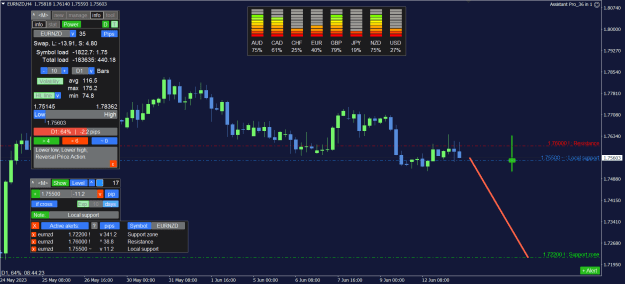
EUR/NZD (4H): the price may soon start a downtrend towards the 1.74300 support area.
Currently we see a lower high at the 1.77 resistance: this may mean the end of the correction phase.
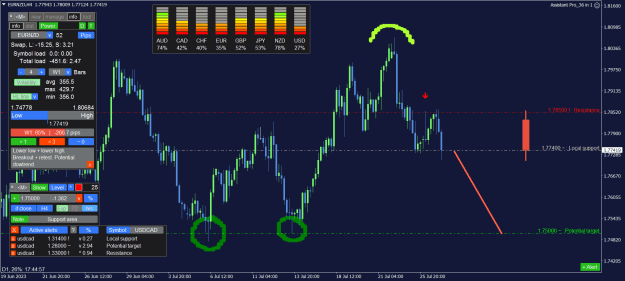
EUR/NZD (4H) may soon break the current 1.314 support and start a downtrend towards the 1.75 area.
Confirmations: breakout + lower low, correction, lower high at the resistance.
EUR/NZD (4H) may soon break the current 1.314 support and start a downtrend towards the 1.75 area. Confirmations: breakout + lower low, correction, lower high at the resistance. {image}
Ignored
No, no, no
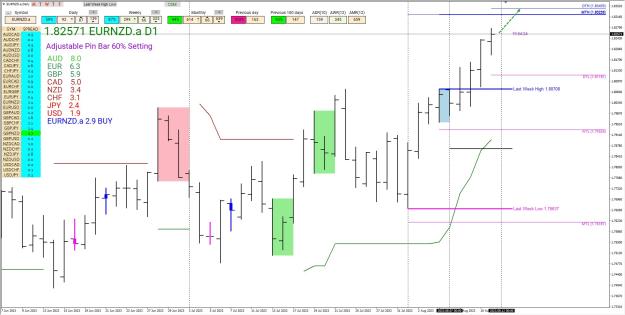
Nice move UP this week off the Inside Day on Monday, August 7 along with a breakout of last week's high, where is that guy that keeps telling me that 80% of breakouts fail?
DTH - Daily Target High is beyond the WTH and MTH, can it get there?