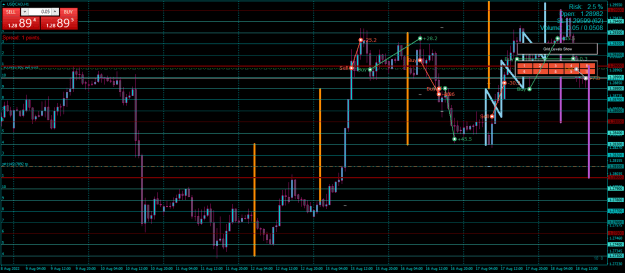
Charts, comments welcome.
Still bit hazy as how to incorporate correctly bigger grid with the smaller one.
Since the bigger grid is bigger, the smaller one based trades can be stopped even the bigger one is still correct.
Still kind of hit and miss a bit. Threading water so far.
Charts, comments welcome. Still bit hazy as how to incorporate correctly bigger grid with the smaller one. Since the bigger grid is bigger the smaller one based trades can be stopped even the bigger one is still correct. Still kind of hit and miss a bit. Threading water so far. {image} {image} {image} {image} {image} {image} {image} {image} {image}
Ignored
Just post one or two pairs per post to keep analysis simple.
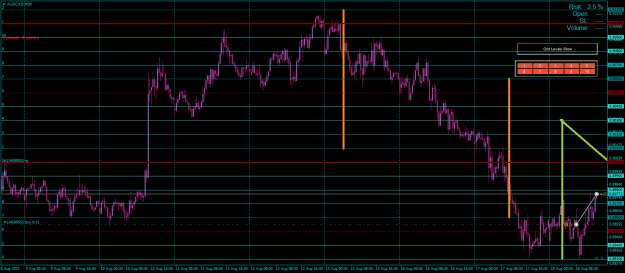
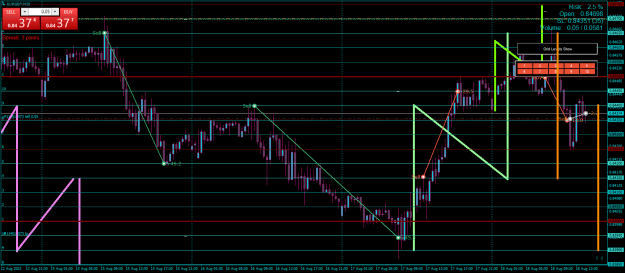
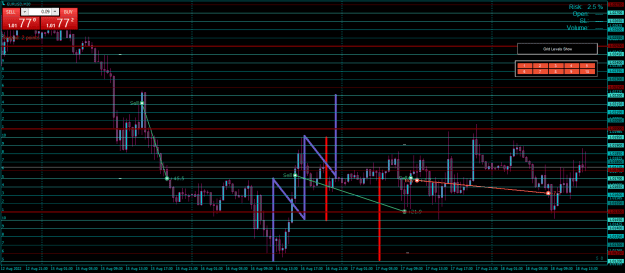
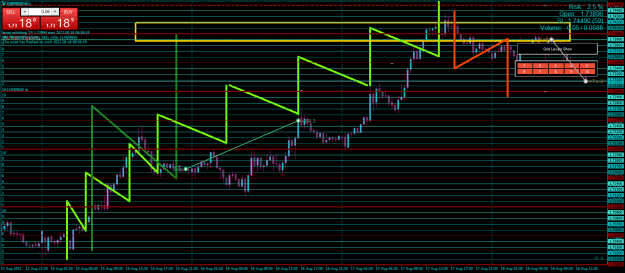
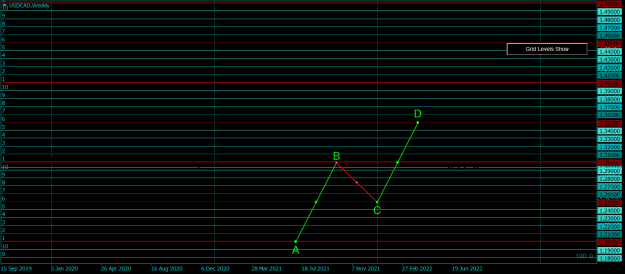
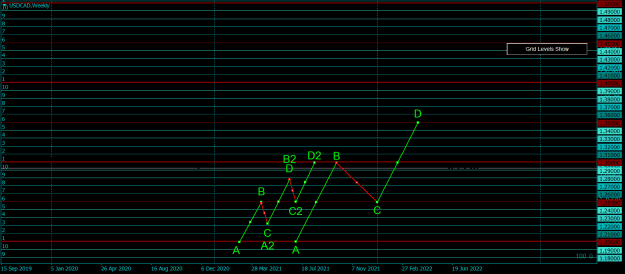
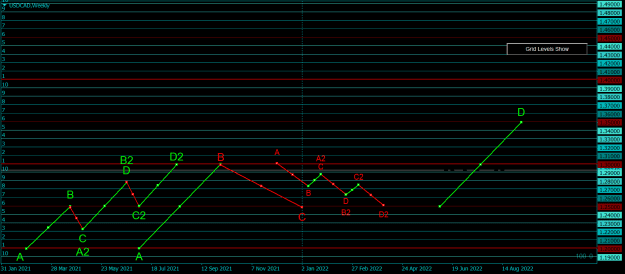
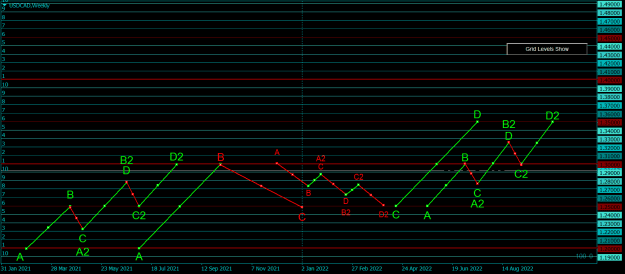
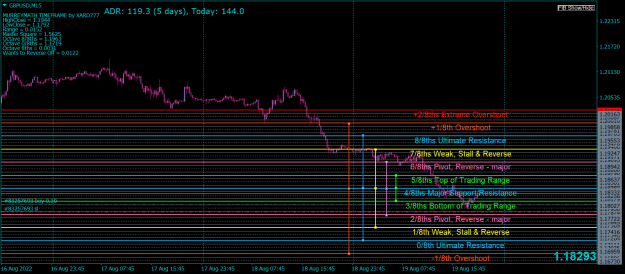
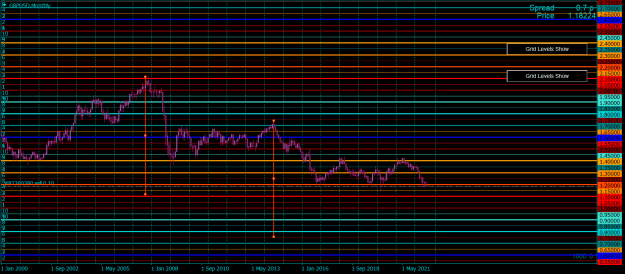
The big grid ABCD prices are the main points or boundaries and determine trend trade direction for the smaller grid within those end points.
For example: Big ABCD is long and I Just hit the B price, I now have a directional bias to sell the market into my C price which will be a retrace of the A to B leg. By looking at my A to B leg with the smaller grid I will count the number of completed ABCD and identify the levels, those will be important resistance levels.
When C level is hit I will reverse my trend bias back to buy trades and use the smaller grid to make trades until the D level is hit.
I mark the B to C leg an opposite color to the AB and CD legs of the move to identify trade direction. In these examples the grid is 100 but I am still able to mark a 50 pip grid. Can u see that?
If I change the grid size by 50% = 50 pips for my large ABCD then the smaller grid would be 25 pips.
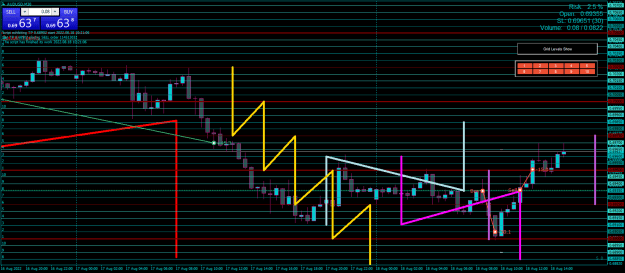
You are getting confused because you have too many pairs open and your marking of ABCD'S are overlapping which causes more confusion.
*Pick one pair and work the large with the small on the largest grid: (500-100) or (100-50) or (10-5).*
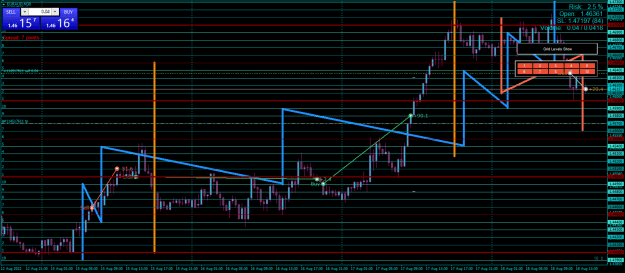
We want to trade 10 or 5 pips grid.
So we should look at two frames above. 25 and 50 pips grids.
I zoom out and will find a peak or bottom.
Will plot out my 50 and 25 pips grid moves.
I will look as where I am direction wise in the ABCD patterns of 50 and 25 pips grid.
Let's say I'm closing on the point B of the 50 pip grid going down.
Now I should be looking for L trades because we expect the market to go to the C point.
How do we know that market won't be continuing down skipping C altogether?
Is there a way to tell that market just overshot the B point and it is actually going to turn to point C?
Since it is a 50 pips grid overshooting point B could mean 100 or 200 pips and markets would still eventually changed direction to get to the C. But we would be left out with a bunch of stop outs to try to get in to that L direction.
How do we deal with the scale difference that can cause us to adhere to the direction that bigger grid tells us to but still ending up with loosers just trying to weather the bigger grid swings before it resumes the correct direction?
Would there be a line from the point B of 50 pip grid that price would have to cross to start looking at the L trades and we would enter only above this line?
How do we deal with runaway markets like GU now where correct direction would be S only since February?
Is there and finite number of swings market can do in one direction? Because GU looks like it's never going to stop going down.
Kind of hard to properly formulate my thoughts on the paper but I hope you understand where I'm coming from and where the confusion might be arising.
Bit of the good old analysis paralysis creep-ed in.
Thank you.
{quote} This should make it clear: {quote} I mark the B to C leg an opposite color to the AB and CD legs of the move to identify trade direction. In these examples the grid is 100 but I am still able to mark a 50 pip grid. Can u see that? If I change the grid size by 50% = 50 pips for my large ABCD then the smaller grid would be 25 pips. You are getting confused because you have too many pairs open and your marking of ABCD'S are overlapping which causes more confusion. *Pick one pair and work the large with the small on the largest grid: (500-100)...
Ignored
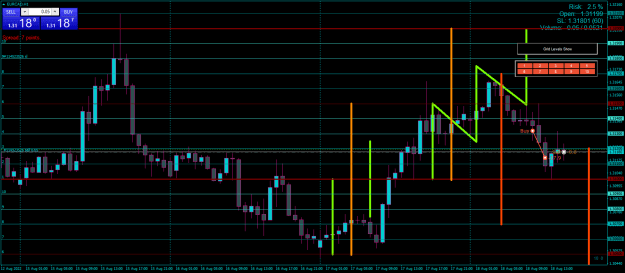
Yes, I can see the smaller grid within the bigger one and that is how I initially understood the idea. What is confusing is how do we deal with the points of reversals that are on the bigger grid where that point can span to 100s of pips and we are trying to fit in to that direction on our smaller grids.
Ok here goes. No charts just words. We want to trade 10 or 5 pips grid. So we should look at two frames above. 25 and 50 pips grids. I zoom out and will find a peak or bottom. Will plot out my 50 and 25 pips grid moves. I will look as where I am direction wise in the ABCD patterns of 50 and 25 pips grid. Let's say I'm closing on the point B of the 50 pip grid going down. Now I should be looking for L trades because we expect the market to go to the C point. How do we know that market won't be continuing down skipping C altogether? Is there a way...
Ignored
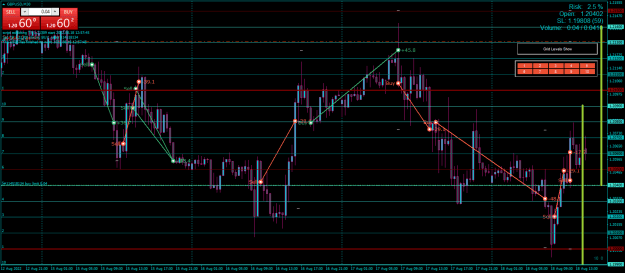
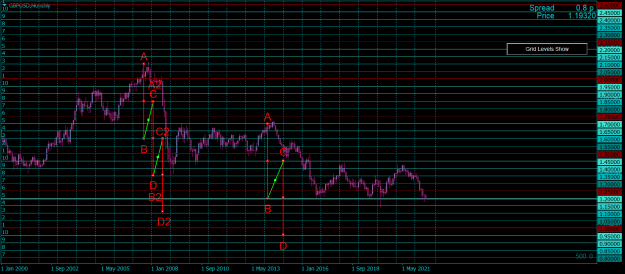
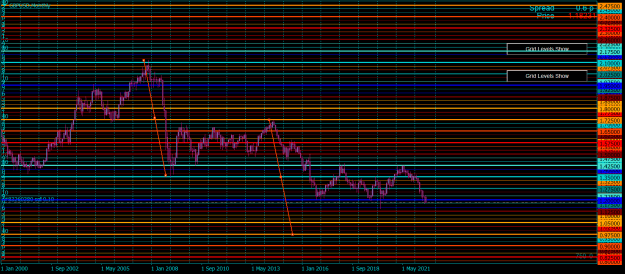
This is why you have to start your analysis of any pair from the left side of the chart with all the history and work your way forward like I showed.
I use the base grids for this task and look for the biggest completed ABCD grid size, when I have that I will plot the next base grid which will take me closer to the current market price until I get to the 10 pip grid. I can go lower if I want but I don't have to.
The base grid step I use are 1000 100 10 for most pairs and will provide the major S and R levels.
If I want to reduce it even further I use 500 50 5.
Obviously, if you do your reductions by 50% it will take you to a off base grid size which you can use BUT for learning you should keep it as simple as possible. The base grids provide a lot of information you have not even considered and until a good majority of traders that have downloaded the indicator start to participate I will be halting any further tips on information not covered.
My Grid V2.ex4 43 KB | 70 downloads | Uploaded Jul 24, 2022 8:45pm. This does not even include V1.
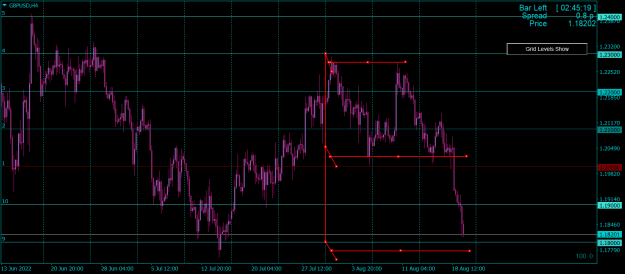
As far as GBP trending down like you said, "Because GU looks like it's never going to stop going down."
Look at my analysis, I showed you it was since here:
{quote} This is why you have to start your analysis of any pair from the left side of the chart with all the history and work your way forward like I showed. I use the base grids for this task and look for the biggest completed ABCD grid size, when I have that I will plot the next base grid which will take me closer to the current market price until I get to the 10 pip grid. I can go lower if I want but I don't have to. The base grid step I use are 1000 100 10 for most pairs and will provide the major S and R levels. If I want to reduce it even...
Ignored
Tony
TBH If I have to give myself a label it would be a Breakout Trader
I find with the aid of your rather clever grids I have now developed what I consider a very good risk reward strategy
Yes not all trades are winners but with sensible Money-management I am moving forward
I have posted my ideas and thoughts but as it does not really take your method of drawing the ABC D into account, not to side track your teaching of the way you want guys to operate your method , I thought it best to give my posts a rest
I can understand your frustration with the number of downloads compared to actual posts, so the lurkers will only have themselves to blame if you do halt your posts that give help and advice to anyone that asks
If the worst does happen and although I perhaps do not follow all your rules to the letter, it will be a great shame
Thank you and good luck
Dave
ps
But hey I am sure you will be back
{quote} Tony TBH If I have to give myself a label it would be a Breakout Trader I find with the aid of your rather clever grids I have now developed what I consider a very good risk reward strategy Yes not all trades are winners but with sensible Money-management I am moving forward I have posted my ideas and thoughts but as it does not really take your method of drawing the ABC D into account, not to side track your teaching of the way you want guys to operate your method , I thought it best to give my posts a rest I can understand your frustration...
Ignored
Dave, I didn't say I was leaving or stop posting I said, I would not progress beyond what I have already provided due to the lack of participation from all the lurkers who have downloaded the grid indicator.
I appreciate you respecting my wishes to keep methodologies pure for now, I would like to see your hybrid grid strategy if your willing to share, maybe you could start a journal for that?
Grid and template is removed due to the lack of interest and participation.
I will still post from time to time and answer any Q's from those who have downloaded and post of their attempts to understand and follow basic instructions starting on post #73.
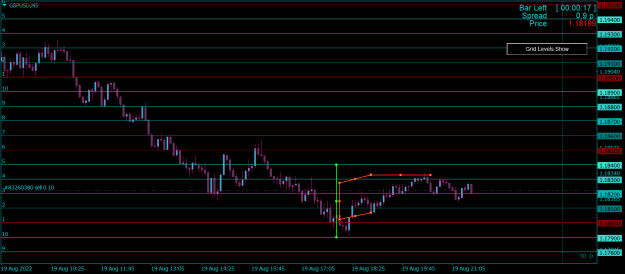
For Dave, I used my grid this way when I started years ago but I found no advantage in this. However the grid produced by your settings did produce a interesting number of 7.5 pips between levels.
The ABCD sequence for a completion using a 1 pip grid will have a completion of D @ 7.5 pips!
A to B 50% = 0-5, B to C 25% = 5-2.5, C to D 75% = 2.5-7.5.
{quote} I am liking this but you are far quicker setting it up than me
Ignored
The operative word being; setting.
.set file for color scheme, save in the indicator and then create a template, now all you have to do is change the grid sizes.
This is how I quickly at a glance identify completed ABCD's which are clearly visible without straining.
Our brains are hard wired to recognize patterns and proportions with colors.