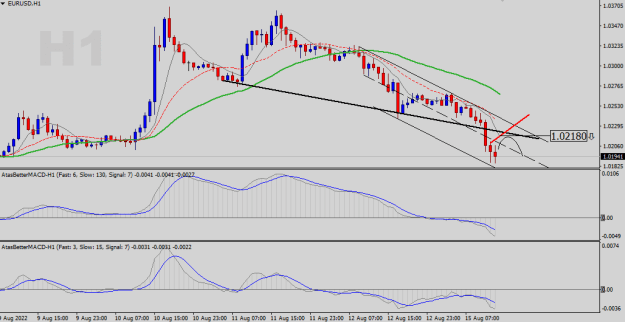
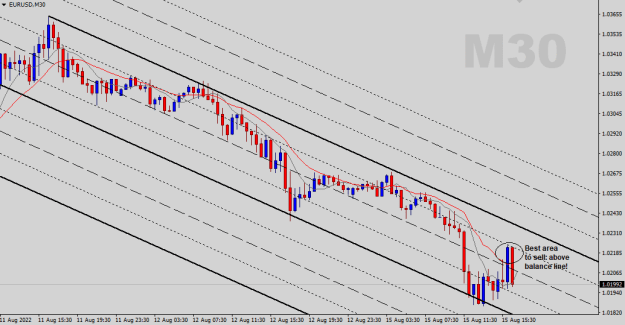
Disliked1.0212 is the nearest resistance I can think, but 1.0231 (where price broke) is stronger level. Also 1.0219 +/- where the Daily broken trendline low is sitting now looks like, a good opportunity, but I'll wait to see a Daily close like, Ata and other traders do. Now I think it is going to create a new resistance level at 1.0207 (because it broke 1.0203) but first we have to see a new low for today, before we mark up on the chart a new decision point. The volatility is growing meaning that this break is real and not fake one like, the last...Ignored
Looking for profitable short term trades ...|