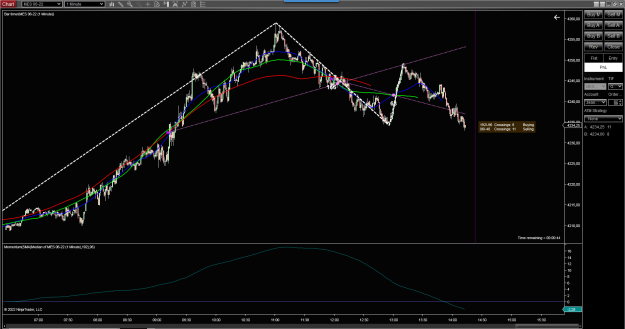
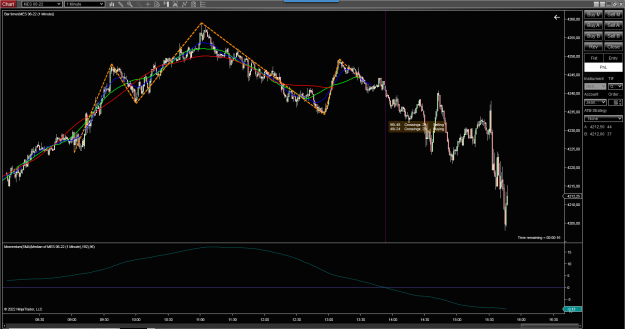
NIFTY 50 1 mn Centered Moving Averages 16 (red) , 32 (blue) , 128 (ocre) What do you see ? {image}
Ignored
Here I see 16 and 32 oscillating around 128 and the intersections aka focal points moving up continuously. Then I see the last intersection happing lower that the previous one indicating change in trend ? Then i see the projected 128 going through the middle of 16 and 32 thereby ending the downtrend ? Also the 16 and 32 have moved up thereby hinting that 1/2 the upcycle is done and remaining 1/2 is in progress ?
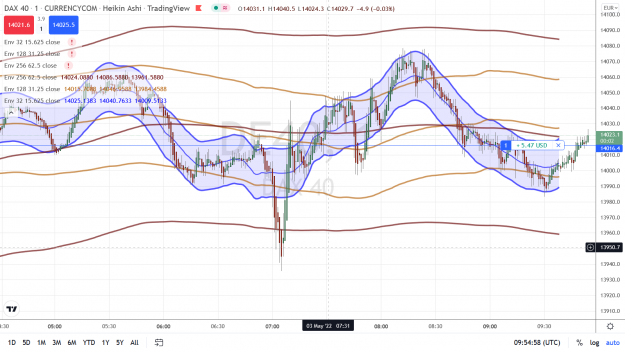
{quote} All i see is that envelope 32 and 128 crashed against the bigger envelope and price came down. This could sound stupid but honestly thats all i see
Ignored
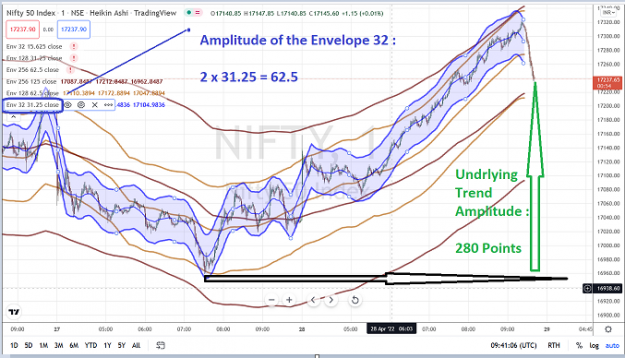
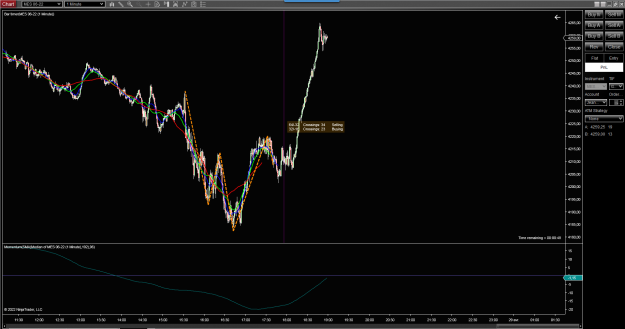
The Underlying Longer Term Trend has 4 Times more influence on Price Action than the shorter trend represented by Envelope 32 - 280 points against 62.5
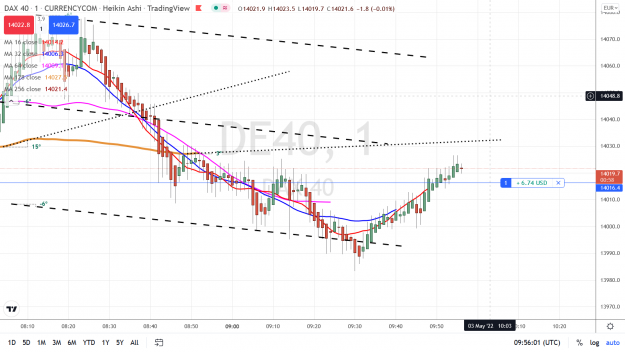
{quote} In MT4 and MT5 these are called SMA (Simple Moving Average). Regarding the extension, algorithmically it is drawn by continuing the slope where the SMA line left off. On my indicators and @parisboy's charts, the portion of the SMA that represents the extension has dots.
Ignored
Hi Robot4me,
sorry if I write to you here but I would like to know how I can get in touch with you.
Thank you
{quote} Do you mind if I ask how you are trading profitably?? Thanks
Ignored
Yes so far I am doing good but my trading strategy is not recommended. I use three systems for trading. 1) Trading Focal Points 2) Billy and Jim TMA band 3) Supply and demand.
I trade against the trend by adding positions. So without proper knowledge and experience , I won’t recommend.
Trading focal point gave me idea of market so my analysis is totally based on this system and TMA bands for entry and exits.
I am trading successfully for only last three months so this period is not good enough to have experience but I have some previous experience so I am trading.
{quote} Yes so far I am doing good but my trading strategy is not recommended. I use three systems for trading. 1) Trading Focal Points 2) Billy and Jim TMA band 3) Supply and demand. I trade against the trend by adding positions. So without proper knowledge and experience , I won’t recommend. Trading focal point gave me idea of market so my analysis is totally based on this system and TMA bands for entry and exits. I am trading successfully for only last three months so this period is not good enough to have experience but I have some previous...
Ignored
What is your strategy for trading focal points? I have been reading parisboy posts for awhile now but havent yet found a strategy to trade with. thanks
{quote} What is your strategy for trading focal points? I have been reading parisboy posts for awhile now but havent yet found a strategy to trade with. thanks
Ignored
My interpretation of trading focal points is totally different. I already mentioned detail in last reply but I think I have to do in my old school way. I use three systems for trading
Trading focal points
Billy and Jim TMA
Supply and demand
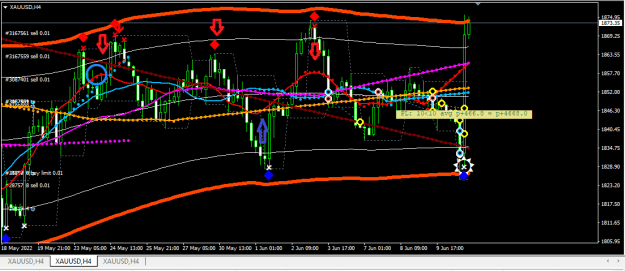
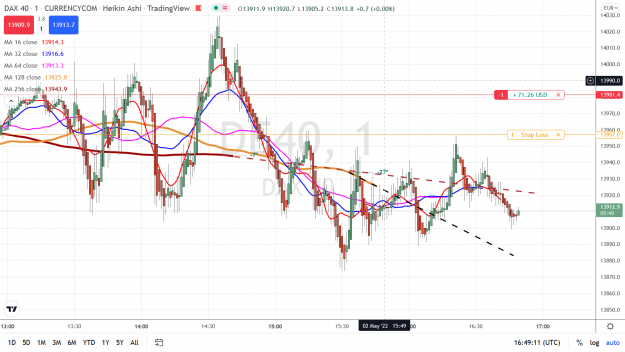
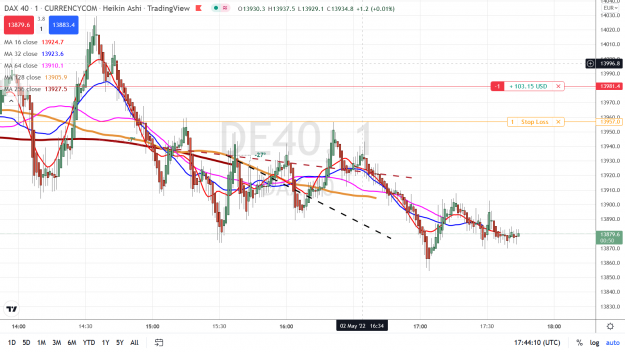
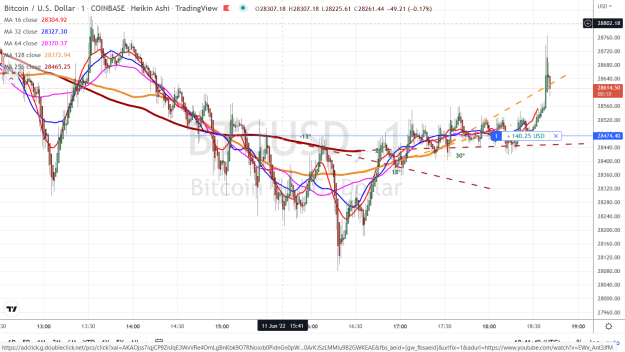
My way of trading is not recommended because I trade against trend. Initially I use Resistance and support levels with limit orders. If price break R3 or S3 level then I add 7 more positions. Here I decide to use other two systems. MA’s ( MA’s of trading focal points) help me to find overbought and oversold level and TMA signal on H4 time frame gives me signal to add positions. My TP is not fix , I change it according to situations. if you see those red arrows, Red line MA is at the top of all other MA's so price overbought and with blue arrow; red MA is at bottom so price is oversold. Sometimes i keep orange/yellow line as target or opposite band. You can see small squares as signal for adding position.