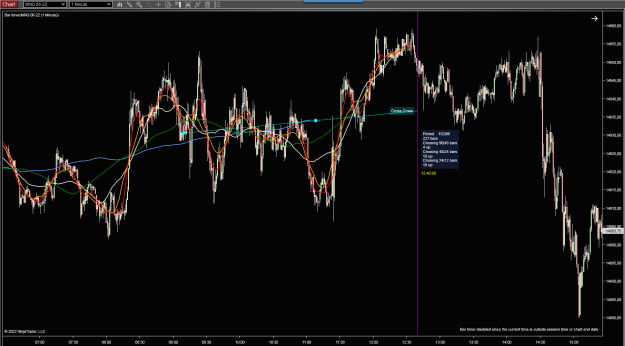
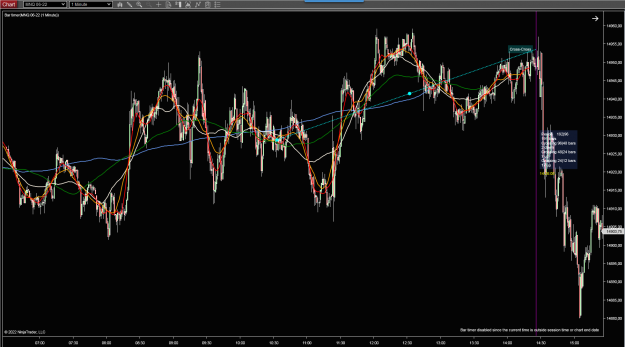
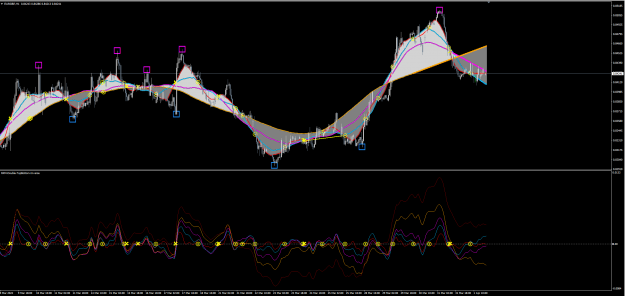
Disliked{quote} A new indicator -- R4M-Double-TopBottom-Inverse. I like it. I've marked major transitions above / below the zero baseline with vertical green lines. It aligns well with the R4M-Sinewaves-Return-To-Mean indicator (which would be expected), as well as with @Swingman's fractal indicator. In addition to providing direction I'm thinking it could also be used for Entries / Exits. {image} {file}Ignored
Subtracting the SMA lines from Price action -- i.e. computing the differences or deltas -- has the effect of normalizing data. We are no longer distracted by the absolute price which will always fluctuate. Normalization is a type of filter that can have the effect of removing noise. When you see the lines move in the same direction that may provide another powerful clue.
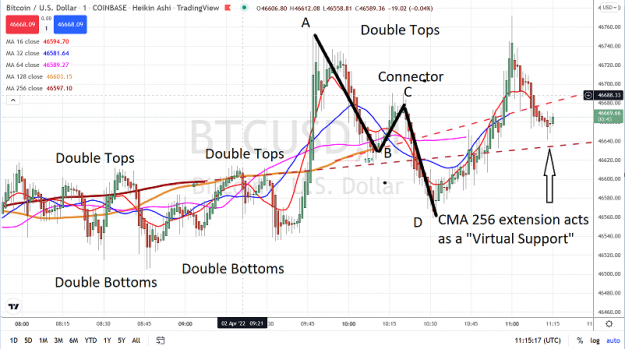
I've also taken the liberty of adding the Double Top / Bottom crossings (16x32 and 16x32x64) -- the same markings as computed in the R4M-Double-TopBottom indicator.
Attached Image (click to enlarge)
Attached File(s)
8