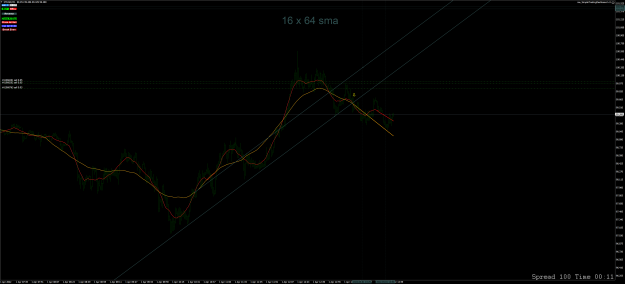
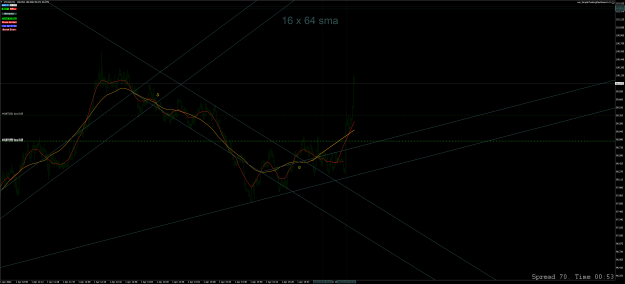
Been messing around with the new indicator this morning on the minute chart on XTI oil
Attached Image (click to enlarge)
Attached Image (click to enlarge)
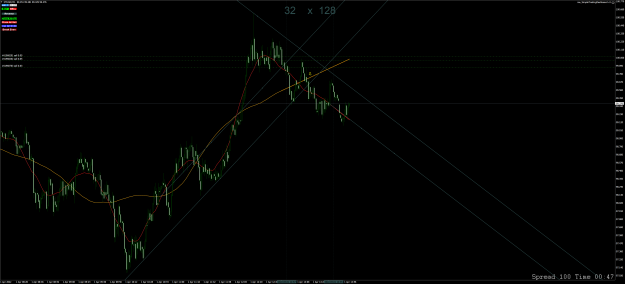
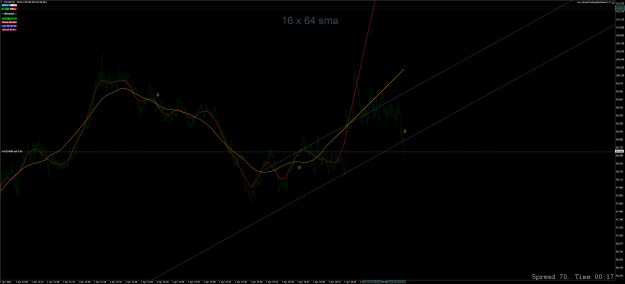
I've used the equidistant channel from the lowest focal point to the highest focal point on both screen shots then I've copied the line from the equidistant channel to the underside edge of the price action on both.
When I got a break of the lower side of the equidistant channel would have went short (yellow arrows).
Forget where I actually went short that's got nothing to do with this system.
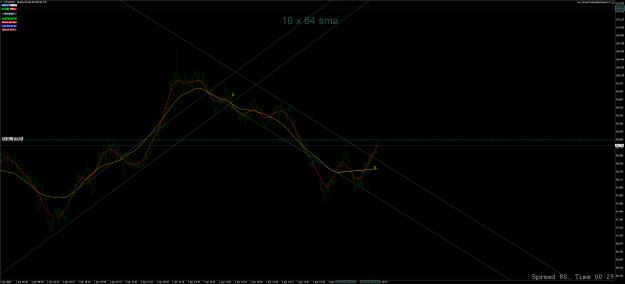
OK back again just gone long Xti oil on 1 minute lets see{image}
Ignored
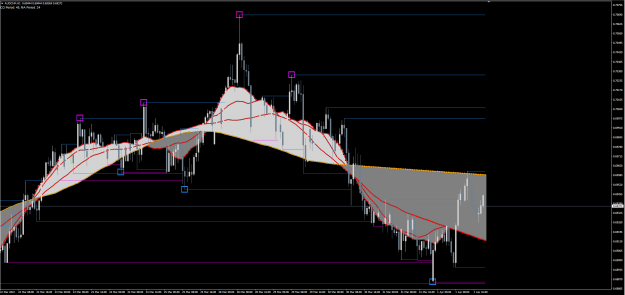
I don't trade below M30, so when it comes to M1 I'm a "fish out of water". Using the Sinewaves-Return-To-Mean indicator it looks to me like a Double Top might be forming. Plus the SMA(128) extension looks to continue to track with PA. So, I'm not sure I would have gone long. Let's see how it goes -- and, if I'm wrong, it would be the first time. And my wife would confirm that...
{quote} I don't trade below M30, so when it comes to M1 I'm a "fish out of water". Using the Sinewaves-Return-To-Mean indicator it looks to me like a Double Top might be forming. Plus the SMA(128) extension looks to continue to track with PA. So, I'm not sure I would have gone long. Let's see how it goes -- and, if I'm wrong, it would be the first time. And my wife would confirm that... {image}
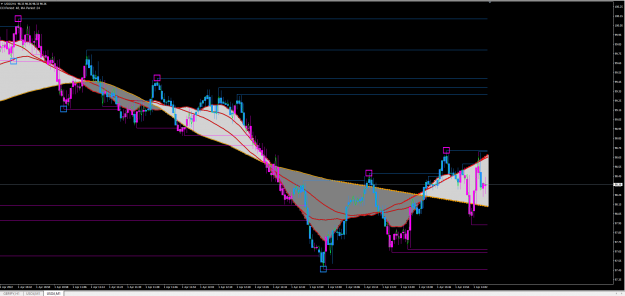
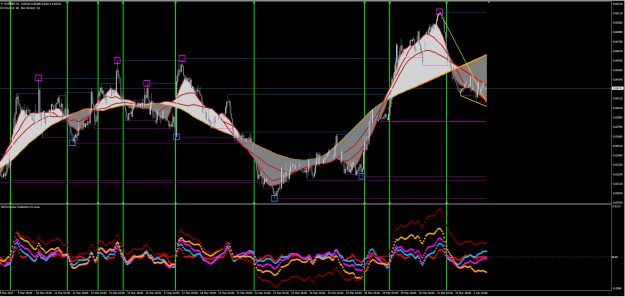
A new indicator -- R4M-Sinewaves-Return-To-Mean. I think you're going to like this one. It is based on @parisboy's post #320 (https://www.forexfactory.com/thread/...9#post13952669) where he introduced a new and simple concept -- "Sinewaves Return To Mean". {image} Note that in the settings you can change which two SMA's to compare. The default is SMA(16) and SMA(128). Check-out the chart below -- this is way too cool. I've attached multiple instances of this indi to the same chart -- SMAs 16x128, 32x128 and 64x128. Notice how...
Ignored
Tons of clues are also given by Inverse Moving Averages.
You just substract your 5 Simple (Centered) Moving Averages from Price Action one at a time. A piece of cake to code.
You plot the result as points about a "zero" baseline, but using Histograms or vertical lines from zero to the value of the difference seems to provide the eye withh more information.
At least it is what Jim Hurst writes in Profit Magic , page 109 to 112
You're going to have to put up with me rambling for a moment, and then I'll share the details...
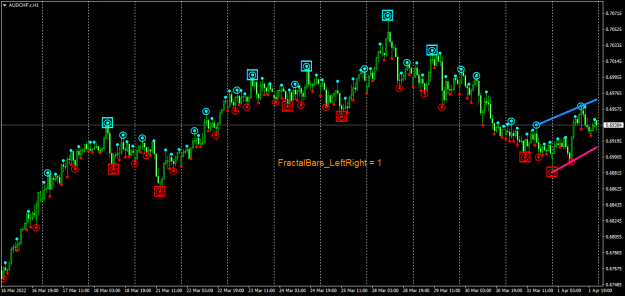
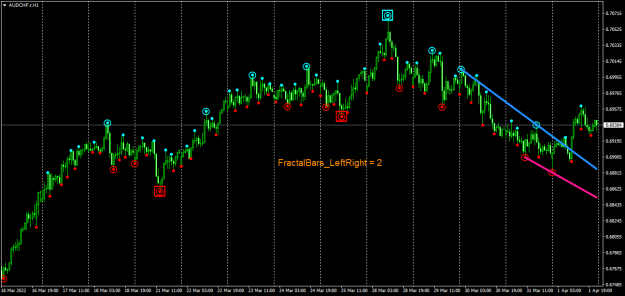
Those additional markings are fractals -- but not just any fractals. I debated with myself whether or not to include them in the chart because they have nothing to do with waves and I didn't want to start down the path of cluttering the charts here with everyone's favorite indicator. Don't get me wrong -- I love indicators -- but this thread is about Focal Points and waves -- both theoretical and practical -- and how to apply them in discretionary trading.
And then a light bulb went on. Wave theory and its applied fallout can only provide us with a DIRECTION. No entries. No exits. Only a direction. We are left to our own devices to figure out where to Enter / Exit a trade. You'll note that all the extra lines that we draw from this crossing to that crossing in an effort to guesstimate a good Entry / Exit have absolutely nothing to do with waves. Rather, they are based on empirical observations of what seems to work. My point is that wave theory goes as far as providing a direction, but for Entries / Exits the burden falls on us. Furthermore, the large backshift applied to the SMA lines means that when trading in real-time the SMA lines drawn on the chart aren't even using the most recent price data. With that, the debate in my head ended and I decided to take a look at fractals.
I like fractals -- but they are not all created equal. Fractal indicators do NOT repaint, but they are DELAYED. They are DELAYED because it takes from 3 to 7 candles to form a fractal pattern. So, you'll never see a fractal at Bar[0] (the current bar) or Bar[1]. Depending on the fractal level, you might start seeing them beginning at Bar[2]. This complicates their use as trading signals. Also, fractals don't work across different time frames like moving averages do. Given a moving average, you may recognize the pattern as you flip through different time frames. But not with fractals. Fractals are based on a very specific candle pattern. So, if you see a fractal at a specific time stamp on an H1 chart, you won't necessarily see it at that same time stamp in an M30 or M1 chart.
With that out of the way, the fractal indicator that I used in that earlier chart comes from master @SwingMan's beautiful fractal indicator. It supports 3 fractal Levels -- Level 1 fractals use a 3-candle pattern, Level 2 fractals use a 5-candle pattern, and Level 3 fractals use a 7-candle pattern. Needless to say, Level 3 fractals are the most strict.
In the chart below I've attached the new R4M-Sinewaves-Return-To-Mean and @SwingMan's smFractalLevels_v3j indicator. It has quite a few settings, so I've also uploaded a template file. What I like about Level 3 fractals is they seem to do a good job of identifying Entries. I'm not sure I would rely on them for Exits, but they seem to correspond with Double Tops / Bottoms. Furthermore, and this is key, though Level 3 fractals are delayed 3 bars, that is way earlier than Double Tops / Bottoms which are typically delayed 16 bars (or more).
@Swingman, sir, if you are reading please feel free to add / subtract anything I've said above. I can not begin to quantify how much I have benefitted from your software over the past few years. And once again, your software finds itself in one of the strategies that I write about...
{quote} And then a light bulb went on. Wave theory and its applied fallout can only provide us with a DIRECTION. No entries. No exits. Only a direction. We are left to our own devices to figure out where to Enter / Exit a trade. You'll note that all the extra lines that we draw from this crossing to that crossing in an effort to guesstimate a good Entry / Exit have absolutely nothing to do with waves. Rather, they are based on empirical observations of what seems to work. My point is that wave theory goes as far as providing a direction, but for Entries / Exits the burden falls on us. Furthermore, the large backshift applied to the SMA lines means that when trading in real-time the SMA lines drawn on the chart aren't even using the most recent price data. With that, the debate in my head ended and I decided to take a look at fractals...
Ignored
R4M
Even if I like very much when you debate with yourself., this statement is just not true. It is just oui-dire repeated blindly without any verification by many posters (kind of "it repaints" thing.)
A Centered Moving Average uses ALL the available price data, the most recent included.
The difference with a "common" Moving Average , commonly used whatever its calculation , is that the last calculated result (including the most recent data) sees its POSITION offsetted back of 1/2 period. Profit Magic Chapter 3, page 65
HOW TO PLOT AND INTERPRET A MOVING AVERAGE PROPERLY
There is, however, one small but important characteristic of a Moving Average which they did overlook. This is demonstrated in the Appendix, and described here.
A Moving Average is an effective smoother of fluctuating time sequences of data.
However, the time relationship between the Moving Average and the data it smoothes is not the one that is always shown on stock price charts.
In fact, the Moving Average data point plotted in association with the last price datum should be associated with a price datum one-half the time span (period) of the average in the past !
Let's make this clearer with an example.
Suppose we're computing the latest possible Moving Average data point for a 10-week Moving Average of the weekly closing price of a stock.
The procedure used is to add up the last 10 weekly closing prices, then divide the sum by 10.
Now on stock price charts, the resulting value of the 10-week Moving Average is always plotted at the time of the last price data point used in computing the average.
This is incorrect !
The proper time relationship between the computed Moving Average and the stock price data it is smoothing is obtained by plotting the value computed above at a time half-way between the fifth and the sixth previous price data points.
This falls in the middle of the week of a weekly chart, and hence is associated with no value for the weekly close of the stock.
For this reason, it is always better to use an odd number of data points in preparing a Moving Average, so that there is always a stock price to be associated with each average datum computed.
...With that out of the way, the fractal indicator that I used in that earlier chart comes from master @SwingMan's beautiful fractal indicator. It supports 3 fractal Levels -- Level 1 fractals use a 3-candle pattern, Level 2 fractals use a 5-candle pattern, and Level 3 fractals use a 7-candle pattern. Needless to say, Level 3 fractals are the most strict...
Ignored
Dear @R4M,
I am glad to know that at least you have found interesting what I have posted from time to time, and thank you for your commitment and your last indicators!
The fractal indicator is indeed an interesting tool, and one could extend it further with Lindsay's original Trident Trading Strategy.
I have to make one short comment, and although your definition of the levels is not entirely correct, the end result is correct. This reminded me of a short story I posted on the forum many years ago after my trip to Tibet...
Correct would be for the parameter Fractal_Bars_LeftRight=1
Level 1=1 bar L/R
Level 2=1 Level 1 L/R
Level 3=1 Level 2 /L/R
and similar for parameter=2.
By your definition, levels 2 and 3 appear earlier than the original rules!
{quote} R4M Even if I like very much when you debate with yourself., this statement is just not true. It is just oui-dire repeated blindly without any verification by many posters (kind of "it repaints" thing.) A Centered Moving Average uses ALL the available price data, the most recent included. The difference with a "common" Moving Average , commonly used whatever its calculation , is that the last calculated result (including the most recent data) sees its POSITION offsetted back of 1/2 period. Profit Magic Chapter 3, page 65 HOW TO PLOT...
Ignored
Excellent post -- a true gem -- thank you, @parisboy. And I am perfectly fine with being wrong -- one of the quickest and most effective ways for me to learn the error of my ways is to stick my neck out and see if it gets chopped off. Kind of like throwing spaghetti at the wall looking for which noodles will stick. I need to noodle (pun intended) on this a bit. And don't worry -- I shall return with questions!!
{quote} Dear @R4M, I am glad to know that at least you have found interesting what I have posted from time to time, and thank you for your commitment and your last indicators! The fractal indicator is indeed an interesting tool, and one could extend it further with Lindsay's original Trident Trading Strategy. I have to make one short comment, and although your definition of the levels is not entirely correct, the end result is correct. This reminded me of a short story I posted on the forum many years ago after my trip...
Ignored
Thank you, @Swingman. I remember the picture, but forgot the story. I hope you don't mind if I repeat it here -- it made me chuckle again. From @Swingman's post in a different thread (circa 2009) https://www.forexfactory.com/thread/...94#post2909494
To better undestand the power of the mantras, I try to tell you a little story about Buddha:
Buddha comes with a small boat on an island and meets a monk there for 5 years repeated the mantra "OM mani padme hom".
Buddha asked him why he does: to be able to run on the water. And you can do: no not yet and I do not know why...
Buddha tells him: I guess that is due to the mantra because correctly it is "padme hum" and not "padme hom". The monk is grateful and buddha goes further with his small boat.
After a mile the monk run after him on the water and asks: how was the correct mantra, I forgot what you've told me...
{quote} R4M Even if I like very much when you debate with yourself., this statement is just not true. It is just oui-dire repeated blindly without any verification by many posters (kind of "it repaints" thing.) A Centered Moving Average uses ALL the available price data, the most recent included. The difference with a "common" Moving Average , commonly used whatever its calculation , is that the last calculated result (including the most recent data) sees its POSITION offsetted back of 1/2 period. Profit Magic Chapter 3, page 65 HOW TO PLOT...
Ignored
Okay -- I've done some initial noodling, though I still require more time...
Regarding the definition of CMA -- I agree. And MT4's corresponding SMA is computed the same way. It does use all the data -- including the most recent bars.
I have a question -- though I first need to create a context. Let's say I'm trading H1 and I'm interested in trading Double Tops / Bottoms. Since Double Tops / Bottoms use 16x32 crossings then the earliest that one can be drawn on a chart is after 16 bars. So, back around Bar[16] I begin to see a DBT being completed. This is great and now I'm looking to go long. So now my question: During the most recent 16 bars the market could make a dramatic downturn and that may not be reflected in the Double Bottom because, though that CMA 32 may include price data from the most recent 16 bars, it also includes price data from earlier bars, which would SKEW it upwards.
When trading PA (Price Action) one typically trades in the here and now -- i.e. the emphasis is on the most recent data. It seems to me a "leap of faith" to trust markings that are skewed with older data. Now -- clearly -- Focal Points and Double Tops / Bottoms work, both in theory and in practice. But I would consider this backshifting a weakness or trade-off. There's nothing wrong with that -- **everything** comes with a trade-off.
Regarding my comment about the wave theory providing direction, but not Entries / Exits. Sine waves have 3 properties -- frequency, length (i.e. period, span) and amplitude. Sine waves can be added and subtracted. Complex Sine waves can be broken down to their component waves using Fourier Transform. However, there are no straight lines in Sine waves. The problem that keeps popping up here is where to Enter / Exit, and the solutions so far have involved drawing a straight lines from "here" to "there". And the reason? Because it seems to work well. And that is great -- I favor empirical over theoretical. If it works, then I'm all in.
Since we've been using straight lines (which have no relation to wave theory) to mark Entries / Exits, then I figured I wouldn't really be deviating from the spirit of the thread if I were to also introduce fractals as another tool to help us identify Entries / Exits. Level 3 fractals seem to be very accurate and they have the benefit of appearing earlier than the completion of a DBT.
{quote} R4M Even if I like very much when you debate with yourself., this statement is just not true. It is just oui-dire repeated blindly without any verification by many posters (kind of "it repaints" thing.) A Centered Moving Average uses ALL the available price data, the most recent included. The difference with a "common" Moving Average , commonly used whatever its calculation , is that the last calculated result (including the most recent data) sees its POSITION offsetted back of 1/2 period. Profit Magic Chapter 3, page 65 HOW TO PLOT...
Ignored
@parisboy -- I'm beginning to come around to see things like you...
Okay -- the CMA / SMA lines do use recent data. However, they also use different backshifts. So, there are times when CMA 16 is using real data and CMA 32 is using extrapolated data. That's the part I'm having trouble getting my head around.
{quote} Tons of clues are also given by Inverse Moving Averages. You just substract your 5 Simple (Centered) Moving Averages from Price Action one at a time. A piece of cake to code. You plot the result as points about a "zero" baseline, but using Histograms or vertical lines from zero to the value of the difference seems to provide the eye withh more information. At least it is what Jim Hurst writes in Profit Magic , page 109 to 112
Ignored
A new indicator -- R4M-Double-TopBottom-Inverse. I like it. I've marked major transitions above / below the zero baseline with vertical green lines. It aligns well with the R4M-Sinewaves-Return-To-Mean indicator (which would be expected), as well as with @Swingman's fractal indicator. In addition to providing direction I'm thinking it could also be used for Entries / Exits.