Thank you very much @robots4me for the encouragement
 Trading Focal Points -- "A Leap Of Faith"...
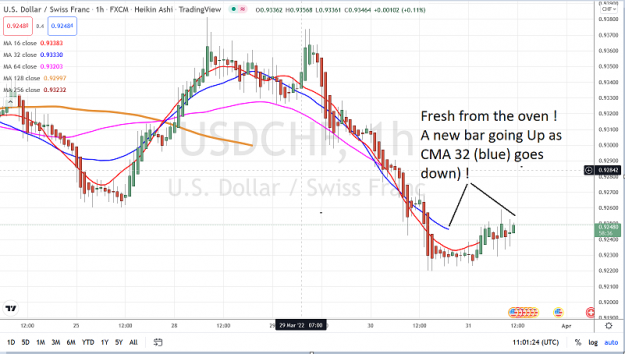
- #306
- Edited 5:29am Mar 31, 2022 4:50am | Edited 5:29am
- Joined Oct 2017 | Status: Trader | 12,472 Posts

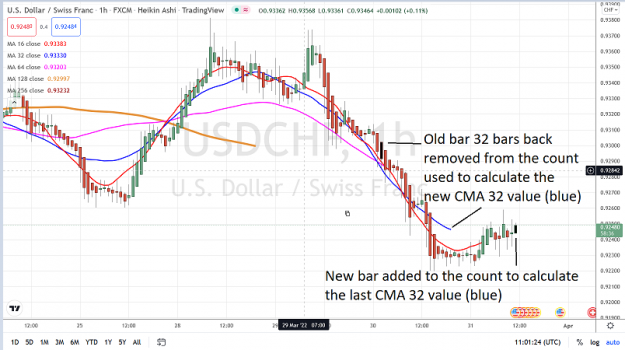
- #309
- Edited 5:58am Mar 31, 2022 5:44am | Edited 5:58am
- Joined Oct 2017 | Status: Trader | 12,472 Posts
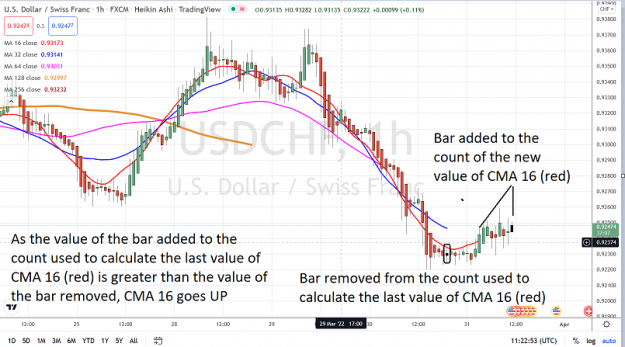
- #312
- Edited 6:31am Mar 31, 2022 6:07am | Edited 6:31am
- Joined Oct 2017 | Status: Trader | 12,472 Posts
- #315
- Mar 31, 2022 6:19am Mar 31, 2022 6:19am
- Joined Aug 2012 | Status: Love for all; Hatred for none | 3,566 Posts
Love for all; Hatred for none.


- #320
- Edited 1:07pm Mar 31, 2022 8:27am | Edited 1:07pm
- Joined Oct 2017 | Status: Trader | 12,472 Posts