{quote} Hi Steve.. Or perhaps Clark Kent or Superman ?? Are you having problems remembering your password for your Ohitsyou account ? you may want to lay off the cannabis gummies or just stick to the cbd ones. Love ya Blue
Ignored
Hey Blue -- nah, I remember it. It's just that after FF binned the original thread then there was no reason to continue with @ohtitsyou. I was looking for a fresh start, which twee had offered awhile back. But, you know me, when coding tasks slow down then I go looking to rattle chains. If this thread can keep me occupied then, who knows, maybe I can go a few weeks without being suspended. Appreciate your concern...
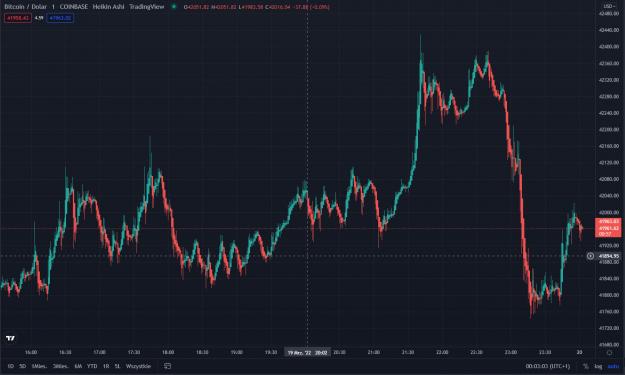
{quote} If I can, I would say no. We need more than that. If the overall trend is Bullish, then I can count on this, likely, not more. {image}
Ignored
Perhaps. ..
I was curious to learn whether the Focal Point theory included guidance on how to trade Double Tops / Bottoms. If there is something new to learn then I'm hungry to learn it. And if there is nothing new to learn then, fine, I'll come up with an empirical approach.
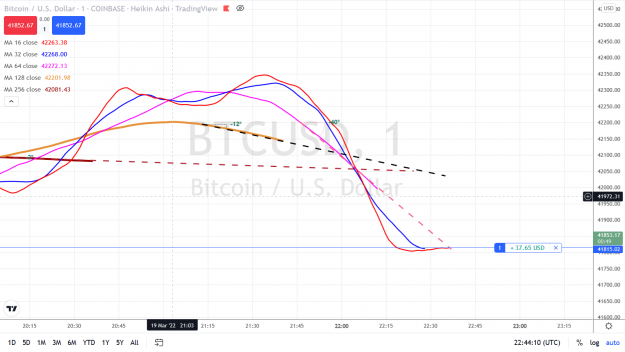
{quote} A possibility. But real experts in Double Tops know surely better entries. {image}
Ignored
Okay. But just as Focal Points includes a calculation to guesstimate a target price, I was wondering if such a calculation (or similar) gets applied to Double Tops, as well.
{quote} Perhaps. .. I was curious to learn whether the Focal Point theory included guidance on how to trade Double Tops / Bottoms. If there is something new to learn then I'm hungry to learn it. And if there is nothing new to learn then, fine, I'll come up with an empirical approach.
Ignored
It seems the overall Trend was not Bullish
Target 41.780 +/-60
It is finished . Ready for a Reversal
Top 42.380
Estimated Focal point : 42.080
Target Price = 41.780 +/- 60
{quote} Hey Blue -- nah, I remember it. It's just that after FF binned the original thread then there was no reason to continue with @ohtitsyou. I was looking for a fresh start, which twee had offered awhile back. But, you know me, when coding tasks slow down then I go looking to rattle chains. If this thread can keep me occupied then, who knows, maybe I can go a few weeks without being suspended. Appreciate your concern...
Ignored
All good..stay out of trouble eh lol...and All the best with Nibiru 😊Cheers 👍Blue
Markets are Mirrors,,Mastery of craft is mastery of self
{quote} Okay. But just as Focal Points includes a calculation to guesstimate a target price, I was wondering if such a calculation (or similar) gets applied to Double Tops, as well.
{quote} All good..stay out of trouble eh lol...and All the best with Nibiru Cheers Blue
Ignored
Nibiru? Nope -- not me. Maybe one of yours? If the alias isn't posting indicators then it's not me. I'm only here to brain-storm and share -- like you...
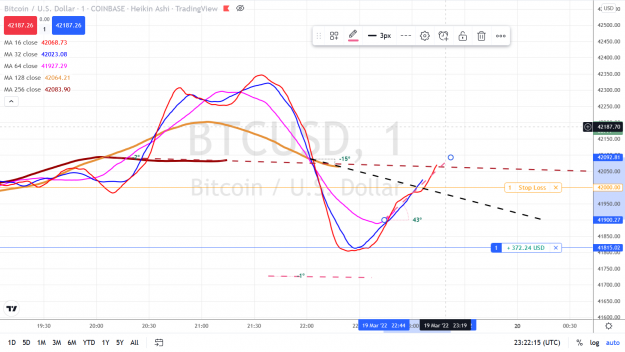
{quote} It seems the overall Trend was not Bullish Target 41.780 +/-60 It is finished . Ready for a Reversal Top 42.380 Estimated Focal point : 42.080 Target Price = 41.780 +/- 60 {image} {image}
Ignored
That's not the same situation. That is about 2 hours later. Or more. You were showing the situation about 17:30. And my comment was about that one.
Attached Image (click to enlarge)
.ex4/.ex5 files can't be fixed or modified / I'm not a coder!
the non-expert , untested idea is : After a downtrend , there is generally a pause or/and a downtrend {image}
Ignored
@parisboy -- another question: What benefit do the SMA(128) and SMA(256) privide? If a valid FocalPoint only requires 16,32,64 then why clutter the chart with additional lines? Is it because when 128,256 do participate in a FocalPoint then, visually, it looks very impressive?
A request -- since I don't trade BTC could you restrict your charts to the forex 28 pairs. That makes it easier to follow along. Also, I only test using the 28 pairs and if a bug were to occur while executing on a BTC chart then I won't catch it and, also, may not be inclined to fix it.
{quote} @parisboy -- another question: What benefit do the SMA(128) and SMA(256) privide? If a valid FocalPoint only requires 16,32,64 then why clutter the chart with additional lines? Is it because when 128,256 do participate in a FocalPoint then, visually, it looks very impressive?
Ignored
they show us the Long Term Trend (relatively to the Time Unit and the Time frame on the scree)
They very often allows us to draw the large Channel / Sinewave in which the lesser Sinewaves Oscillate