Understand how a Double Top forms itself Jim Tillman and Double Bottoms When there is a double bottom or a double top, you should consider that there might be a cycle changing direction half-way between those two points. {image} {image} {image}
{quote} in MT4 are SMA's offsetted back of half of their period ?
Ignored
I incorporated the half-period back-shifting in my indicator. You can do something similar with MT4's built-in moving average -- there is an option to add a shift. In this case the shift value would be a negative number.
A by the Book Jim Tillman Focal Points Channel almost LIVE a) we used Centered Moving Averages 16, 32 and 64 b) these CMA's generated 2 Focal Points where they crossed together with Price Action c) you draw a straight line between these 2 Focal Points d) you draw 2 parallels one from the Top of the Swing , the other from the Low e) you observe the result {image}
Ignored
@parisboy -- this is so cool.
Look it -- this parallels how PlanetX works, though Focal Points is deeper and richer. PlanetX came about from empirical observation, whereas Focal Points has a theoretical basis. I would say that PlanetX is Focal Points "lite".
It's no surprise they share a similar ancestry -- they are both MA-based. It's like the difference between chocolate chip ice cream and mint chocolate ice cream. Both are ice cream and both have chocolate chips...
Thanks to @Parisboy and @R4m, the conversation regarding CMAs have progressed nicely into a focal point indicator which turns out to be very good at picking out swing zones. Good job guys.
Next on the agenda is how to deploy Focal Point effectively in combination with PlanetX. Below are my initial thoughts and suggestions. Please note that everyone must find what works best.
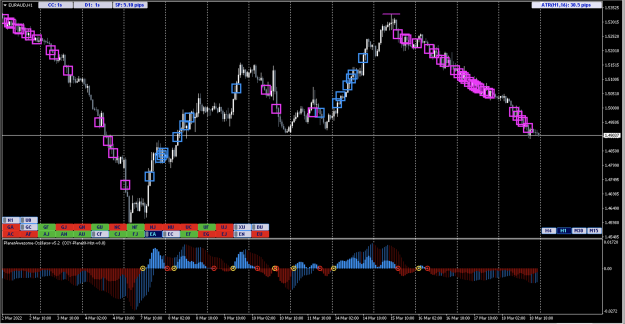
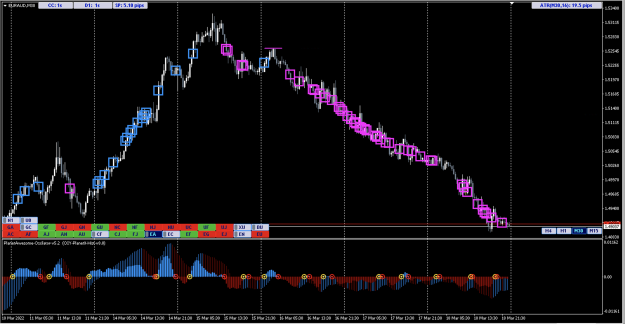
Focal Point picked the swings nicely almost all the time. Could be used as a trend change detector. The swings are coded Blue(long) and Pink (short).
If Focal Point is used to set direction, PlanetX can be used as entries (in the direction of the swing) and exits (when opposite the direction of swing)
Alternatively, Focal Points can be used alone as entries and exits.
For example: look at the EURAUD chart below. for every focal point, place a trade with the ATR of the timeframe as profit target. close the trade at profit target or stop loss or opposite signal. H1 ATR for EA is 30pips. 80-90% of those signals would have been profit trades.
Set the bias aside and take a closer look at @parisboy's Focal Point strategy -- it works. If you are lucky a light bulb will go on. Just be careful not to slap your forehead too hard...
Ignored
Well, I don't know what to do with those focal points.
They are useless, because I need a signal where I'm pointing.
Then I know where to put my Stop Loss. Next I need to estimate the most likely Take Profit, and I can do that.
When I have my SL & TP prices, then all I need is my Optimal Entry Price, which is at 0.618 pullback, so tahat I get 1 SL to 1.618 TP.
So, if my risk is 2% (SL), my TP is at 3.236%.
Thus, I have earned 2% for my future SL and 1.236% extra.
Now, all I need to do is NOT take worse deals than that.
Attached Image (click to enlarge)
If you're looking for the Holy Grail indicator - STOP!
A by the Book Jim Tillman Focal Points Channel almost LIVE a) we used Centered Moving Averages 16, 32 and 64 b) these CMA's generated 2 Focal Points where they crossed together with Price Action c) you draw a straight line between these 2 Focal Points d) you draw 2 parallels one from the Top of the Swing , the other from the Low e) you observe the result {image}
Ignored
That's Andrews' Pitchfork...
If you're looking for the Holy Grail indicator - STOP!
not exactly. there is similarities., visual similarities.
But there is no (official) "theoretical explanation of why Andrews Fork work.
Moreover Andrews locates the Midline of the Fork in the Middle of the Swing. Focal Points are generated differently through the crossing of CMA's and can be located also on the Middle of the Swing ..... or not.
I will come back later on Andrews because it is important and can be useful for trading.if Bishopdootun and Robots4me do not consider it clutters tge thread
{quote} Well, I don't know what to do with those focal points. They are useless, because I need a signal where I'm pointing. Then I know where to put my Stop Loss. Next I need to estimate the most likely Take Profit, and I can do that. When I have my SL & TP prices, then all I need is my Optimal Entry Price, which is at 0.618 pullback, so tahat I get 1 SL to 1.618 TP. So, if my risk is 2% (SL), my TP is at 3.236%. Thus, I have earned 2% for my future SL and 1.236% extra. Now, all I need to do is NOT take worse deals than that. {image}
Ignored
@BestTraderEv -- you haven't been reading. Focal Points are not signals. I've emphasized this a couple of time in recent posts.
Focal Points are HISTORICAL meeting points of 3 friends -- Mr. SMA(16), Mr. SMA(32) and Mr. SMA 64). They do not meet to trade. However, after their two most recent meetings they go home and perform a very simple calculation that guesstimates where price is headed. If you like their guesstimate then you can Enter a trade at that point. At the point at which you Enter a trade there are NO markings or signals -- the Focal Points occurred in the past. However, what you do have in your hands is a good idea where price is headed. It's different. Neither of us have traded before this way before. It also has a theoretical basis. And what's even more interesting is that the use of SMA(16) and SMA(32) is very similar to the basis of PlanetX.
I think you may need to revisit the post where I distilled @parisboy's initial charts into a set of codeable rules. That's what I had to do in order to create the R4M-FocalPoints indicator.
You're determined to fit that circular peg into a square hole...
This is different from what you and I are familiar with. Turns out that occasionally something new under the sun passes our way. It doesn't mean that it is better and it doesn't mean you have to embrace it. But in order to stop battling with it you'll need to set aside those bias blinders -- just for an hour or so. Ironically, as we've learned, Focal Points aren't really new. They are almost as old as me.
![Click to Enlarge
Name: [DAX40]M15.jpg
Size: 498 KB](/attachment/image/4167643/thumbnail?d=1647709651)