I'm going to throw something at you that is completely unorthodox. But it proves a point.
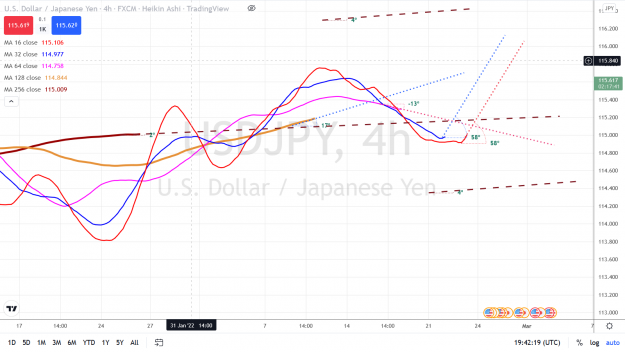
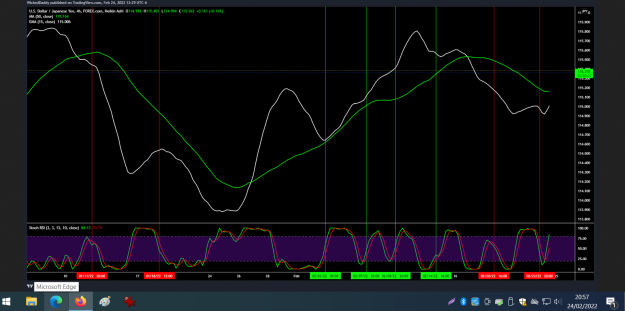
The chart below is USDJPY 4HR. We focus so much on candles that for this exercise, I have removed them. There are 8 vertical lines on the chart. Red is to enter short. Green is to enter long. The criteria for a trade is:
1. White (15 EMA) crosses Green (50 SMA)
2. StochasticRSI opposite cycle, then green (K) crosses red (D) AND is in the purple zone (between 80% and 20%) - enter here or add to the trade here.
What do you see?
There are two trades, the 6th and the 8th that would be barely profitable if held very short term - a few hours max. The rest are very profitable. To be fair though, ff we count 6 and 8 as being losses (hitting a stop loss), you still have a 75% success rate in just these 8 trades alone. Do the math. 6 good winners, 2 small losers depending on your risk tolerance.
Sometimes, eliminating the complexity can make things abundantly clear.
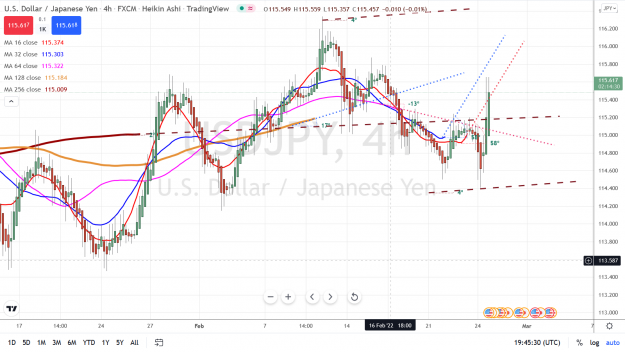
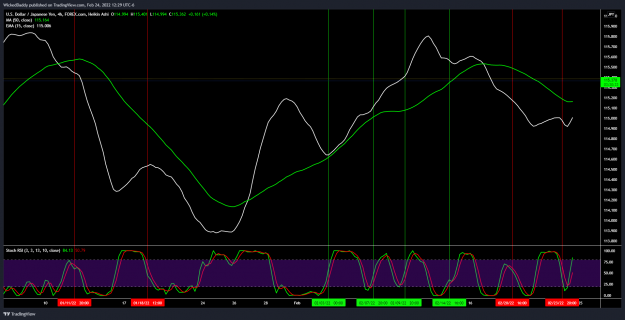
The chart below is USDJPY 4HR. We focus so much on candles that for this exercise, I have removed them. There are 8 vertical lines on the chart. Red is to enter short. Green is to enter long. The criteria for a trade is:
1. White (15 EMA) crosses Green (50 SMA)
2. StochasticRSI opposite cycle, then green (K) crosses red (D) AND is in the purple zone (between 80% and 20%) - enter here or add to the trade here.
What do you see?
Attached Image (click to enlarge)
There are two trades, the 6th and the 8th that would be barely profitable if held very short term - a few hours max. The rest are very profitable. To be fair though, ff we count 6 and 8 as being losses (hitting a stop loss), you still have a 75% success rate in just these 8 trades alone. Do the math. 6 good winners, 2 small losers depending on your risk tolerance.
Sometimes, eliminating the complexity can make things abundantly clear.
10