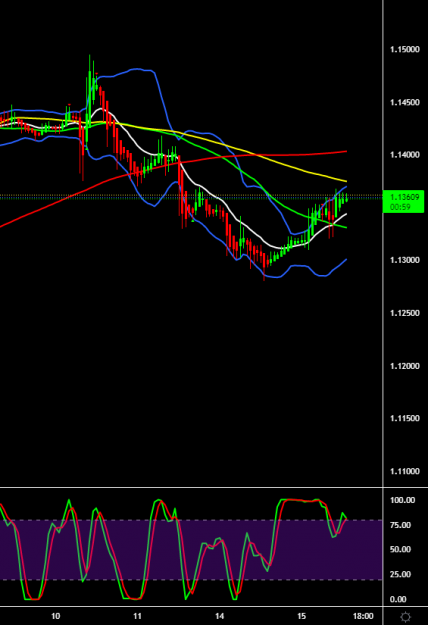
Disliked{quote} Kofix11 do you know what is the instrument tradedien the chart showed and its timeframeIgnored
- #146
- Feb 15, 2022 12:38pm Feb 15, 2022 12:38pm
- Joined Sep 2008 | Status: Verry good | 1,267 Posts
Just an opinion. Based on research 
- #148
- Feb 15, 2022 1:30pm Feb 15, 2022 1:30pm
- Joined Sep 2008 | Status: Verry good | 1,267 Posts
Just an opinion. Based on research
- #155
- Feb 15, 2022 2:31pm Feb 15, 2022 2:31pm
- Joined Sep 2008 | Status: Verry good | 1,267 Posts
Just an opinion. Based on research