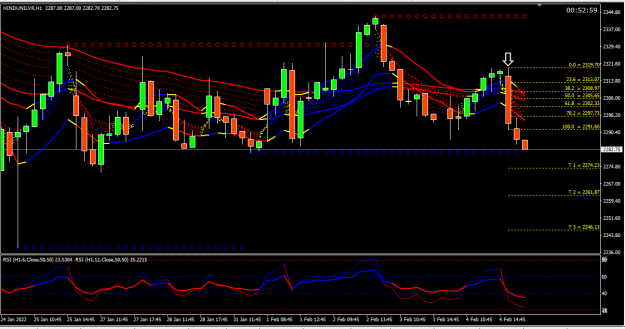
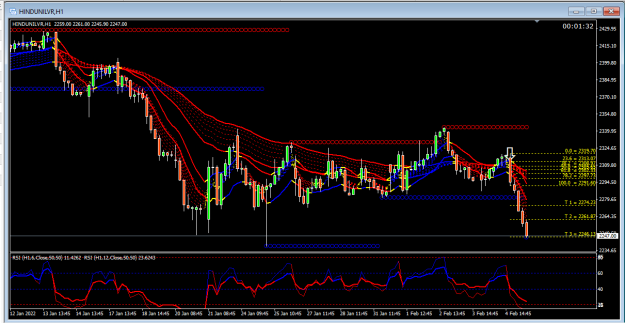
lastly about rsi...
1) depends on what setting are used . rsi 6 will cross 50 much earlier than rsi 14 0r rsi 21.( same is true for all other oscillators like macd, stochastics, tdi, cci etc)
indian markets are 6 hrs a day. so on hourly chart i use 6 and 12 rsi, means that i understand what is happening in the last 2 daily candles. i am not concerned what happeneg 14 or 21 days back.
2) rsi above 50 is uptrend and below 50 is downtrend.
rsi between 60 to 80 is strong uptrend,
when rsi goes beyond 80 you have to consider taking profits off the table.
3) rsi 6 crossing below 12 and/or both crossing 50 in opposite direction ..... get out of the trade irrespective of profit and loss.
that is the logic behind the charts
1

![Click to Enlarge
Name: EURAUD[M] 240 Min #5 2022-02-06 18_54_25.209.png
Size: 25 KB](/attachment/image/4138569/thumbnail?d=1644166585)