• Home
  • Forums
  • Trades
  • News
  • Calendar
  • Market
  • Brokers
  • Login
  • Join
  • User/Email: Password:
  • 4:52pm
Menu
  • Forums
  • Trades
  • News
  • Calendar
  • Market
  • Brokers
  • Login
  • Join
  • 4:52pm
Sister Sites
  • Metals Mine
  • Energy EXCH
  • Crypto Craft

Options

Bookmark Thread

First Page First Unread Last Page Last Post

Print Thread

Similar Threads

Most Volatile & Crazy Month? 6 replies

Anyone try using XAU/USD - XAU/EUR as proxy for EUR/USD? 4 replies

The most volatile pairs? 5 replies

the most volatile instrument 4 replies

Most volatile over the long term? 0 replies

  • Interactive Trading
  • /
  • Reply to Thread
  • Subscribe
  • 376
Attachments: Most volatile EU/GU/XAU/BTC trading
Exit Attachments

Most volatile EU/GU/XAU/BTC trading

  • Last Post
  •  
  • 1 1718Page 192021 45
  • 1 18Page 1920 45
  •  
  • Post #361
  • Quote
  • Edited at 12:52pm Jan 20, 2022 12:42pm | Edited at 12:52pm
  •  heispark
  • Joined Apr 2011 | Status: Hoc Etiam Transibit.... | 4,924 Posts
Quoting BlackNapkins
Disliked
{quote} Some people use divergency of cumulative delta and price
Ignored
Yes, I know. Divergence looks popular and in fact seems it's the only and prevailing usage of cumulative delta. However, divergence is hindsight view and I consider divergence is a joke.
Simplicity is the ultimate sophistication - Leonardo da Vinci
 
2
  • Post #362
  • Quote
  • Jan 20, 2022 12:48pm Jan 20, 2022 12:48pm
  •  BlackNapkins
  • Joined Jan 2016 | Status: Member | 913 Posts
Quoting ryuryu
Disliked
{quote} I need context.
Ignored
Ryuryu, what I can say,
You are very generous person, thank you!
BN
 
1
  • Post #363
  • Quote
  • Jan 20, 2022 12:52pm Jan 20, 2022 12:52pm
  •  BlackNapkins
  • Joined Jan 2016 | Status: Member | 913 Posts
Quoting heispark
Disliked
{quote} Yes, I know. Divergence looks popular and in fact the only and prevailing usage of cumulative delta. However, divergence is hindsight view and I consider divergence is a joke.
Ignored
Verbally I am agree with you concerning divergency.
BN
 
 
  • Post #364
  • Quote
  • Jan 20, 2022 12:58pm Jan 20, 2022 12:58pm
  •  DrDave
  • Joined Jun 2011 | Status: Member | 6,656 Posts
Quoting ryuryu
Disliked
{quote} Thank you for clarification! Now I understand. In my case >ema6 high is of course >ema6 close but I need to catch exactly if price >ema6 high. Sometimes even it's high must be higher. It is not necessary to use 6/30/120/240/480 etc. You can use any you like. I just thought that since we are taking about time there are 60 pieces, not 100. That's why for example ema 50/100/200 make no big sence for me. It is just the start point from what to start the calculation from. The same way I'm calculating the envelope distance for each pair. I'm using...
Ignored
use 6/30/120/240/480 etc.

60 as the base has good logic.
Similarly, some people use Daily as the base. 24hrs=1440 minutes, and then have minute TFs
1440/720/360/180/90/45/23/12/6/3/1

(The quick witted took note of 360/180/90).
The markets are speaking to you. Do you know their language? I M T
 
1
  • Post #365
  • Quote
  • Edited at 2:33pm Jan 20, 2022 2:22pm | Edited at 2:33pm
  •  ryuryu
  • Joined Apr 2020 | Status: Member | 1,391 Posts
Quoting DrDave
Disliked
{quote} use 6/30/120/240/480 etc. 60 as the base has good logic. Similarly, some people use Daily as the base. 24hrs=1440 minutes, and then have minute TFs 1440/720/360/180/90/45/23/12/6/3/1 (The quick witted took note of 360/180/90).
Ignored
Yeah, you are right. At least it has more sense than 50/100/200 for sure.

Also about daily open. It works perfect on crypto, because the market is open 24/7 and there are no gaps.
On forex it works not good because of gaps, because it works only 24/5 and has strong marked sessions. Because of that the data is incorrect.
I prefer use, I called it, Asian Middle. I start to watch high and low from 2am (+2 hours from day start) to 9:59 (London Open). And then draw the middle line. It is much more accurate. Of course if you are not trading Asian session. Otherwise daily open is the only choice.

And the same about moving average and every indicators. They work not good on forex 1h-4h for that reason too. They have incorrect, incomplete and corrupted data because of sessions and 24/5. So that is the reason why I trade forex on lower TFs. Because then the data is ok.

Quoting BlackNapkins
Disliked
{quote} Ryuryu, what I can say, You are very generous person, thank you!
Ignored
Look at the XRP chart once again. When I posted it few hours back I want to write the question for you "How you think where it should go?"
I was sure, that it will bounce from EMA120.

Attached Image

And it bounced. That's why I prefer close the position as soon as possible. Here we have EMA120 before EMA6 low, so there is no big room to trade.
As one "trader" said in another thread "big traders respect 200 EMA". Haha. As you see they "respect" 120 EMA as well
In fact this is total bullshit, because average is AVERAGE, and that's why price always will hit it. Not because traders respect it haha

p.s. it could pierce through all the EMAs and go deep underwater as well. But divination is not my forte.
Observer effect
 
2
  • Post #366
  • Quote
  • Jan 20, 2022 11:44pm Jan 20, 2022 11:44pm
  •  ryuryu
  • Joined Apr 2020 | Status: Member | 1,391 Posts
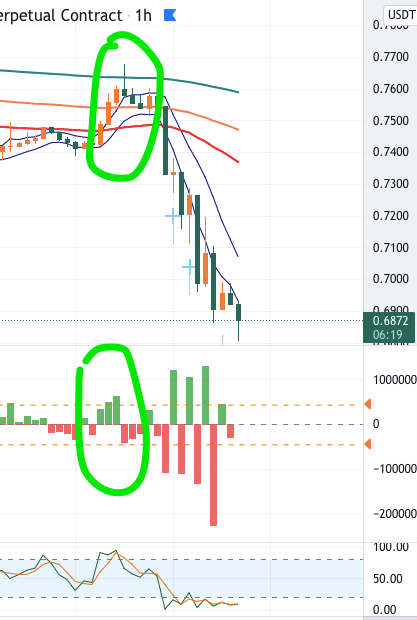
Yesterday it was a clear signal on most crypto shitcoins. I have chosen Matic.

Attached Image

And the day starts with +42% profit. Nice drop! it was -12%, the leverage about 5. Very very good.


BTW there is an approach called 3 screens. I have the same but 3 charts (of 5, 10 whatever you like). How it works: first you need to choose few coins you trade with similar bias. Then choose one to trade, but check other to confirm the entry. Like "too small candle" or "too long shadows". Let's say if 5/5 then ok. If 5/1 then do not enter, better skip it.
For example yesterday the same signal was found exactly at the same candle on doge, near, xrp, matic, algo.
Observer effect
 
3
  • Post #367
  • Quote
  • Jan 21, 2022 2:01am Jan 21, 2022 2:01am
  •  ryuryu
  • Joined Apr 2020 | Status: Member | 1,391 Posts
Let's study a little how to combine MA, Stoch and Delta entries/exits.

Attached Image

As you see on the chart there were clear entry on XRP
1. Stoch was on top
2. MAs are in bear order
3. It was >=3 positive delta's in a row and then negative. Amount was also good.


Now let's check next. As you see it was green delta -> red delta. But there were no "3 in a row" rule. So there were no signals for long entries.

To make a trading decision all rules must math. Like 5 of 5. If there are 4 of matched for example, you should check another coins. If there are 3 of 5 you can open you trade with small amount and low leverage. Or it is better just to skip and wait for another opportunity. There is no need to hurry. You must be absolutely sure.

People ask me question where to set SL? Personally I'm not using SL for the first entry. If I'm wrong I just reverse the trade after next candle close. If second try fail too then I just close everything is loss and start to look for new entry. But before I pause all the trading for 6 hours at least. No hurry, no greed, no fear, no revenge trades.
Observer effect
 
2
  • Post #368
  • Quote
  • Jan 21, 2022 3:42am Jan 21, 2022 3:42am
  •  ryuryu
  • Joined Apr 2020 | Status: Member | 1,391 Posts
Quoting BlackNapkins
Disliked
I prepared profile for learning and testing methodology... {image} Same stuff is prepared for EURUSD and XAUUSD... weekend will be busy...
Ignored
Looks good. But there is no need to have m15. It just make more mess. 1m and 1H are good!

Since you don't have a formula to calculate the distance I can post it every day.

XAU - 694 points
EU - 283 points
GBP - 298

p.s. take a look that distance for EU and GU are about equal. Summer/Autumn GBP was much bigger. About 350-450 range. Now it is collapsed. That's why for me no GBP trades. There is no room to trade.
Observer effect
 
1
  • Post #369
  • Quote
  • Jan 21, 2022 6:12am Jan 21, 2022 6:12am
  •  BlackNapkins
  • Joined Jan 2016 | Status: Member | 913 Posts
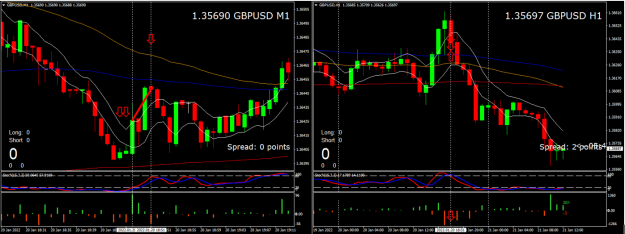
Not all elements of context are shown here, but those that are strong enough discourage long positions

Attached Image (click to enlarge)
Click to Enlarge

Name: example 1.png
Size: 177 KB
BN
 
1
  • Post #370
  • Quote
  • Jan 21, 2022 6:26am Jan 21, 2022 6:26am
  •  ryuryu
  • Joined Apr 2020 | Status: Member | 1,391 Posts
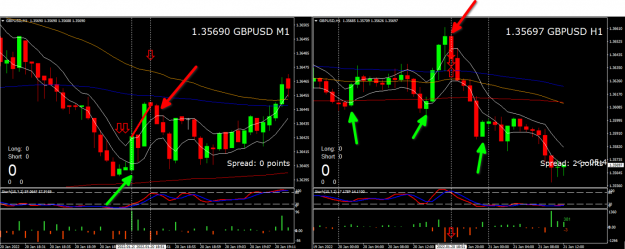
I would pick these trades. Red arrow = short, green = long.
I see you have 1m and 1H but MAs are very strange... and they have different time...

Anyway, this way:

Attached Image (click to enlarge)
Click to Enlarge

Name: screenshot.png
Size: 189 KB

On the fisrt screeshot there were first big delta, but the candle is too small. So the entry is after next one only.
Observer effect
 
1
  • Post #371
  • Quote
  • Edited at 7:08am Jan 21, 2022 6:36am | Edited at 7:08am
  •  BlackNapkins
  • Joined Jan 2016 | Status: Member | 913 Posts
Thank Your !

On both M1 and H1 I have
6EMA High/Low, White
60EMA Close, Gold
120 EMA Close, Blue
240 EMA cCose Red
BN
 
1
  • Post #372
  • Quote
  • Jan 21, 2022 6:42am Jan 21, 2022 6:42am
  •  BlackNapkins
  • Joined Jan 2016 | Status: Member | 913 Posts
https://www.forexfactory.com/thread/...10#post3528310
How about this kind of watching MA's vs TF? This is other way round to adopt MA's to commonly used TF then Dr. Dave's interesting concept.
BN
 
 
  • Post #373
  • Quote
  • Jan 21, 2022 7:00am Jan 21, 2022 7:00am
  •  DrDave
  • Joined Jun 2011 | Status: Member | 6,656 Posts
Quoting ryuryu
Disliked
{quote} Yeah, you are right. At least it has more sense than 50/100/200 for sure. Also about daily open. It works perfect on crypto, because the market is open 24/7 and there are no gaps. On forex it works not good because of gaps, because it works only 24/5 and has strong marked sessions. Because of that the data is incorrect. I prefer use, I called it, Asian Middle. I start to watch high and low from 2am (+2 hours from day start) to 9:59 (London Open). And then draw the middle line. It is much more accurate. Of course if you are not trading Asian...
Ignored
the same about moving average and every indicators. They work not good on forex 1h-4h for that reason too. They have incorrect, incomplete and corrupted data

For the way that you are using the MAs, then you are probably right. But from a purely technical aspect of MAs versus timeframe, there is no difference in what they show because of the fractal-like nature of the TFs. I can show you plots of price bars or MAs from any TF that do not include the time and price axes and you will not be able to determine which TF you are looking at. The MAs are just a smoothed version of price vs time, so they are just an aid in seeing direction and direction change.
Quoting Tukey, Exploratory Data Analysis
Disliked
We make it smooth to ease the eye's task and keep the eye from getting stuck on trivia.
Ignored
Another smoothing method that someday I will check with financial time series is Tukey's use of moving medians and plotting the smoothed values as well as the residuals, and continuing with repeating the smoothing on the new sequence until there is no change.
The markets are speaking to you. Do you know their language? I M T
 
2
  • Post #374
  • Quote
  • Jan 21, 2022 8:00am Jan 21, 2022 8:00am
  •  ryuryu
  • Joined Apr 2020 | Status: Member | 1,391 Posts
Moving average is great indicator. For me there is no need to adjust it or make it better. It is just perfect. Same with Stoch. It is perfect too.
In my trading approach I need MA for 3 reasons. First and main reason is to show the local trend direction. For that purpose I'm using 3 moving averages. Why I need trend? Because I don't like to piss against the wind. Better to ride it.
Second reason is to set TP. Since it is average price tend to hit or bounce from it.
Third reason is to draw envelopes. I need them to understand the distance and to answer the question "where I am?" And for TP reason too.

I know that many traders are searching for "non-lagging" MA, trying many settings, smoothing types and so on. I don't need it, because MA is already perfect.

About corrupted data. I mean... check last 2 hours and first 2 hours. There are
a) gaps
b) wide spreads
c) abnormal candle sizes

Since MA calculate itself using, for example, candle close value, the data of 10% of trading time is corrupted. And since MA is smoothed thru time the errors are spreading to next candles.
Observer effect
 
1
  • Post #375
  • Quote
  • Edited at 9:56am Jan 21, 2022 8:42am | Edited at 9:56am
  •  ryuryu
  • Joined Apr 2020 | Status: Member | 1,391 Posts
I'm done for today +2.95% on forex

20 trades on Gold and one on GBP. Today was no loss trades.
That GBP trade was a mistake haha. I was changing the chart checking things. And forgot to switch back to XAU. And saw beautiful setup. Jumped in, jumped out. And was very strange that the profit was that small. Then I realized that that was not XAU, but GBP

+0.21% XAU Long
+0.09% XAU Long
+0.10% XAU Short
+0.20% XAU Long
+0.14% XAU Long
+0.13% XAU Long
+0.11% XAU Long
+0.10% GBP Short
+0.05% XAU Long
+0.15% XAU Long
+0.02% XAU Short
+0.05% XAU Short
+0.08% XAU Long
+0.33% XAU Long
+0.20% XAU Short
+0.08% XAU Long
+0.14% XAU Short
+0.03% XAU Long
+0.09% XAU Short
+0.43% XAU Long
+0.18% XAU Long

Crypto trades today
+5.95% BTCUSD Short
+1.12% BTCUSD Short
+8.89% BTCUSD Long

+16.67%

+85.67% MATICUSDT Short
+42% total (yesterday doge long was negative)
Observer effect
 
5
  • Post #376
  • Quote
  • Jan 21, 2022 12:16pm Jan 21, 2022 12:16pm
  •  heispark
  • Joined Apr 2011 | Status: Hoc Etiam Transibit.... | 4,924 Posts
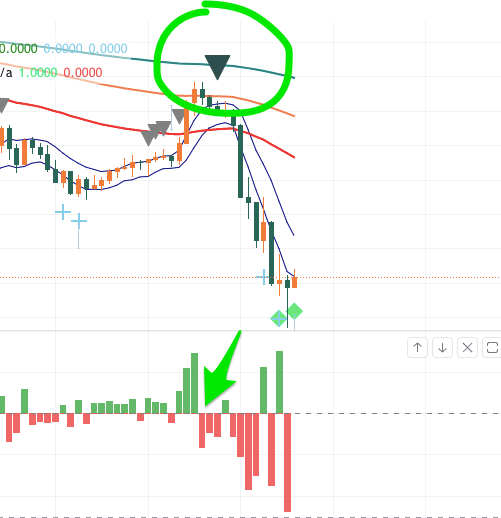
Although I don't really follow Ryan's strategy, his usage of Delta Volume is pretty interesting and creative. I am trying to attach this to my own strategy....
The following is 1M /NG chart (sorry, yes it's a hindsight chart). Delta Volume quick reverse. Cumulative delta is a bonus.
Attached Image (click to enlarge)
Click to Enlarge

Name: 2022-01-22_02-08-09.png
Size: 2.9 MB
Simplicity is the ultimate sophistication - Leonardo da Vinci
 
2
  • Post #377
  • Quote
  • Jan 22, 2022 3:47am Jan 22, 2022 3:47am
  •  ryuryu
  • Joined Apr 2020 | Status: Member | 1,391 Posts
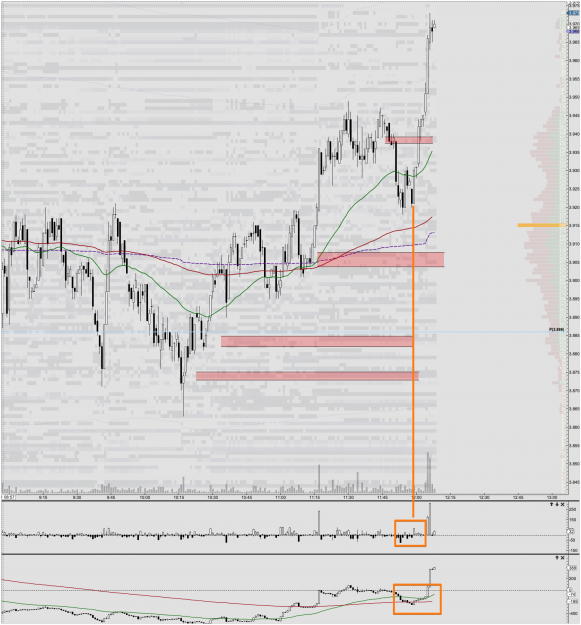
Good news everyone!

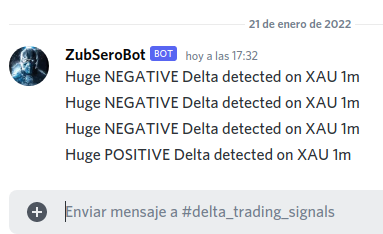
I have created a bot that search for market imbalances.
It look like this:

Attached Image

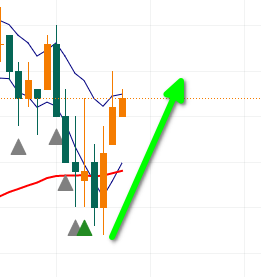
As you see huge negative delta (3 in a row) changed to huge positive.

What happened at that time on the market:
Attached Image

Of course we need context. Where is the price. What are stoch/RSI values. What is the local and main trend.
Also you must understand that this is 1m scalping signals. They are for professional scalpers only (too fast, but good to test the discord and bot features)

I will add EURUSD, GBPUSD and major crypto coins and will create separate channel for each one.

How I use it: like alarm. As you know I'm trading crypto on 1H tf and there is no need to hurry. And there is no need to sit and watch the charts for hours.
Just get your signal, open the chart, examine it and make a decision open the trade or not. That easy.

Ah yes is it totally free for you my friends!
Observer effect
 
4
  • Post #378
  • Quote
  • Jan 22, 2022 5:39am Jan 22, 2022 5:39am
  •  RickM
  • Joined Sep 2015 | Status: Member | 1,799 Posts
Quoting ryuryu
Disliked
Good news everyone! I have created a bot that search for market imbalances. It look like this: {image} As you see huge negative delta (3 in a row) changed to huge positive. What happened at that time on the market: {image} Of course we need context. Where is the price. What are stoch/RSI values. What is the local and main trend. Also you must understand that this is 1m scalping signals. They are for professional scalpers only (too fast, but good to test the discord and bot features) I will add EURUSD, GBPUSD and major crypto coins and...
Ignored
Hi Ryan

Another great tool and I like your term "context".

I am using his tool as I speak at 7pm on a Saturday night.
Signal - Possible market imbalance detected! Huge NEGATIVE Volume Delta found on BTC 1H TF

We previously just had a couple of bullish signals (on my software) against a strong trend - then came Ryan's strong delta signal.

Result for me was a nice winner +0.75% of my equity.

Lets not put on any stupid lines on a chart, any 3 bar reversal setups, any bearish engulfing candle stick patterns - or any other traditional bullshit TA method.
If the Market orders coming through the market are Selling, and the big players are NOT ABSORBING these orders

You ain't going to lose to often (Once you understand Liquidity)

Now, all I need to do is pay Ryan the fee

JOKING - He charges NOTHING for his signals

What are you waiting?
Seriously
Trading thin liquidity at the boundary of the charts
 
2
  • Post #379
  • Quote
  • Jan 22, 2022 6:18am Jan 22, 2022 6:18am
  •  ryuryu
  • Joined Apr 2020 | Status: Member | 1,391 Posts
Quoting RickM
Disliked
{quote} Hi Ryan Another great tool and I like your term "context". I am using his tool as I speak at 7pm on a Saturday night. Signal - Possible market imbalance detected! Huge NEGATIVE Volume Delta found on BTC 1H TF We previously just had a couple of bullish signals (on my software) against a strong trend - then came Ryan's strong delta signal. Result for me was a nice winner +0.75% of my equity. Lets not put on any stupid lines on a chart, any 3 bar reversal setups, any bearish engulfing candle stick patterns - or any other traditional bullshit...
Ignored


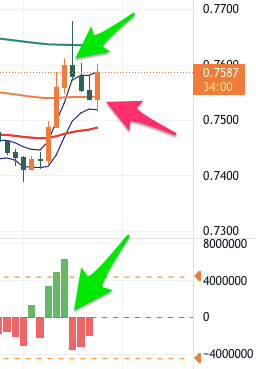
Yeah, the context is everything. Like here. BTC dropped too much and it took too much time already. So it is pretty safe to open long after huge delta found 3 times in a row and them huge buy delta.

I took that one:

Attached Image

And I gained +4.48% in BTC and +1.76% in USDT.
Let me tell you one "hint". It works perfect on longs if you have both btc and usdt.

First you can enter short with 1x leverage on BTC. It will give you positive funding rate very 8 hours. If the entry is correct then you can close it in profit and re-open new one. If it is in loss - don't panic. Wait till positive delta signal occur, check the context, buy BTC on spot, transfer them to you derivatives.
Then close in profit, remove all the BTC profit, leave some profit in btc (like I leave 4.48%). Transfer all back to spot and sell.
And you will have double profit, one in BTC and one in usdt. In my case I have increased my BTC value at 4.48% and my USDT value at 1.76%
Observer effect
 
1
  • Post #380
  • Quote
  • Jan 22, 2022 7:05am Jan 22, 2022 7:05am
  •  KevinZeng
  • | Joined Jan 2020 | Status: Member | 148 Posts
Quoting ryuryu
Disliked
Good news everyone! I have created a bot that search for market imbalances. It look like this: {image} As you see huge negative delta (3 in a row) changed to huge positive. What happened at that time on the market: {image} Of course we need context. Where is the price. What are stoch/RSI values. What is the local and main trend. Also you must understand that this is 1m scalping signals. They are for professional scalpers only (too fast, but good to test the discord and bot features) I will add EURUSD, GBPUSD and major crypto coins and...
Ignored
hi ryuryu,
How to get your bot tool?
 
1
  • Interactive Trading
  • /
  • Most volatile EU/GU/XAU/BTC trading
  • Reply to Thread
    • 1 1718Page 192021 45
    • 1 18Page 1920 45
3 members viewing:
anelija
,
FundedCoffee
,
Invisible
  • More
Top of Page
Forex Factory Blog Updated: Alerting All Members
  • Facebook
  • Twitter
About FF
  • Mission
  • Products
  • User Guide
  • Media Kit
  • Blog
  • Contact
FF Products
  • Forums
  • Trades
  • Calendar
  • News
  • Market
  • Brokers
  • Trade Explorer
FF Website
  • Homepage
  • Search
  • Members
  • Report a Bug
Follow FF
  • Facebook
  • Twitter

FF Sister Sites:

  • Metals Mine
  • Energy EXCH
  • Crypto Craft

Forex Factory® is a brand of Fair Economy, Inc.

Terms of Service / ©2022