• Home
  • Forums
  • Trades
  • News
  • Calendar
  • Market
  • Brokers
  • Login
  • Join
  • 10:44am
Menu
  • Forums
  • Trades
  • News
  • Calendar
  • Market
  • Brokers
  • Login
  • Join
  • 10:44am
Sister Sites
  • Metals Mine
  • Energy EXCH
  • Crypto Craft

Options

Bookmark Thread

First Page First Unread Last Page Last Post

Print Thread

Similar Threads

FX statistical arbitrage 11 replies

Statistical arbitrage position closer required 3 replies

Statistical Arbitrage Trading by EA 34 replies

Statistical arbitrage, hedge, or bluffing myself? 16 replies

statistical arbitrage 1 reply

  • Trading Journals
  • /
  • Reply to Thread
  • Subscribe
  • 43
Attachments: Statistical arbitrage and pairs trading on Forex
Exit Attachments
Tags: Statistical arbitrage and pairs trading on Forex
Cancel

Statistical arbitrage and pairs trading on Forex

  • Last Post
  •  
  • 1 Page 23456 7
  • 1 Page 234 7
  •  
  • Post #21
  • Quote
  • Jan 4, 2022 9:31am Jan 4, 2022 9:31am
  •  howard
  • | Joined Sep 2006 | Status: howard | 1,681 Posts
Analiteg
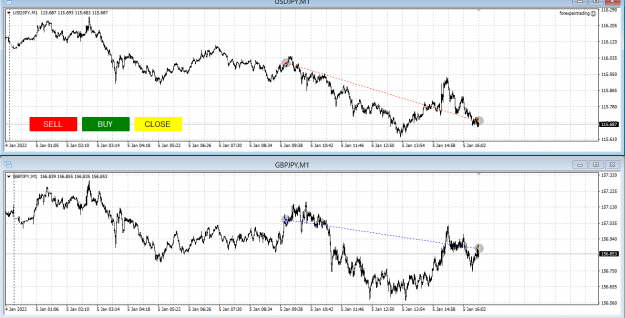
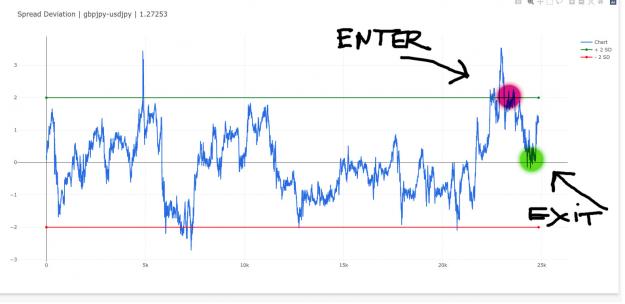
As you explained, when spread goes to +2 we want to sell pair 2; so is it not better to attach the trading panel to chart of pair 2? In that case we can press the sell button which corresponds with "sell" action of pair 2.
And when spread goes to -2, we press on buy button which corresponds with buy action of pair 2 again.
Regards
 
 
  • Post #22
  • Quote
  • Jan 4, 2022 9:35am Jan 4, 2022 9:35am
  •  analiteg
  • Joined Dec 2021 | Status: pairs trader | 67 Posts
As for me, it is not so important, to which schedule the panel is attached. The main thing is not to cross the direction. You can do as you like. I know that some of my traders generally open only one chart with a panel and do not look at the second chart.
 
 
  • Post #23
  • Quote
  • Jan 4, 2022 10:31am Jan 4, 2022 10:31am
  •  rebol6
  • | Joined Jan 2022 | Status: Junior Member | 3 Posts
Hi, analiteg. What is the best date-range to use on your real-time dashboard for short time trading?
 
 
  • Post #24
  • Quote
  • Jan 4, 2022 10:48am Jan 4, 2022 10:48am
  •  analiteg
  • Joined Dec 2021 | Status: pairs trader | 67 Posts
Quoting rebol6
Disliked
Hi, analiteg. What is the best date-range to use on your real-time dashboard for short time trading?
Ignored
Hi!
I use 20 days.
 
 
  • Post #25
  • Quote
  • Edited 7:42pm Jan 4, 2022 4:54pm | Edited 7:42pm
  •  StJohns
  • | Joined Jan 2022 | Status: Member | 9 Posts
hi analiteg, great info!
How do you calculate the lot size coefficient for different pairs? Or you always use 1:1 ?
Thanks!
 
 
  • Post #26
  • Quote
  • Jan 4, 2022 10:55pm Jan 4, 2022 10:55pm
  •  Mark9999
  • | Joined Feb 2019 | Status: Member | 12 Posts
Quoting analiteg
Disliked
{quote} Hi, Mark. p-value is statistical value. Two time series are cointegrated if the p-value is less than 0.05. We should trade only cointegrated pairs.
Ignored
Hi Analiteg,
Thank you for your response and this thread. I'm still trying to understand everything that you have presented.

I understand now why your looking for p-value less then 0.05 as 'A p-value less than 0.05 (typically ≤ 0.05) is statistically significant. It indicates strong evidence against the null hypothesis, as there is less than a 5% probability the null is correct (and the results are random). Therefore, we reject the null hypothesis, and accept the alternative hypothesis.'

My understanding is that calculating p-value is composed of 3 parts:
1. The probability random chance would result in the observation.
2. The probability of observing something else that is equally rare.
3. The probability of observing something rarer or more extreme.

Are you creating a statistical distribution from the spread of the 2 currencies to calculate p-value for co-integration? Why is spread considered stationary when price is not?

With the spread formula what is x in 'Spread = A - x*B'?

Did you use a co-integration formula to come up with the pairs that you are trading?
 
 
  • Post #27
  • Quote
  • Jan 5, 2022 1:42am Jan 5, 2022 1:42am
  •  analiteg
  • Joined Dec 2021 | Status: pairs trader | 67 Posts
Quoting StJohns
Disliked
hi analiteg, great info! How do you calculate the lot size coefficient for different pairs? Or you always use 1:1 ? Thanks!
Ignored
Usually, I use 1:1. But you can calculate it as Pair 1 point value / Pair 2 point value.
 
 
  • Post #28
  • Quote
  • Jan 5, 2022 4:19am Jan 5, 2022 4:19am
  •  analiteg
  • Joined Dec 2021 | Status: pairs trader | 67 Posts
Quoting Mark9999
Disliked
{quote} Hi Analiteg, Thank you for your response and this thread. I'm still trying to understand everything that you have presented. I understand now why your looking for p-value less then 0.05 as 'A p-value less than 0.05 (typically ≤ 0.05) is statistically significant. It indicates strong evidence against the null hypothesis, as there is less than a 5% probability the null is correct (and the results are random). Therefore, we reject the null hypothesis, and accept the alternative hypothesis.' My understanding is that calculating p-value...
Ignored
Hi, Mark!
More details about Cointegration and Stationarity you can find here.

A commonly untested assumption in time series analysis is the stationarity of the data. Data are stationary when the parameters of the data generating process do not change over time.

As we predict the spread, it should be a stationary value. We can check the spread for stationarity withAugmented Dickey Fuller test.
I have added to the dashboard spread stationarity value. It should be less than 0.01.

A cointegration value shows how strong the connection between currency pairs is. It should be less than 0.05.
If pairs cointegrated their spread is stationary.
 
 
  • Post #29
  • Quote
  • Jan 5, 2022 4:47am Jan 5, 2022 4:47am
  •  analiteg
  • Joined Dec 2021 | Status: pairs trader | 67 Posts
One good person suggested to me, that if the spread is stationary, then the currency pairs are also cointegrated. This means, that there is no need to simultaneously check currency pairs for cointegration and spread for stationarity.

So in the dashboard, I will leave only the indicator of spread stationarity. If it is below 0.01, it means that the currency pairs are cointegrated, and you can watch the deviation of the spread from the mean and look for signals for trades.

Cointegration calculation is very expensive and requires a lot of server resources (CPU and RAM).
 
 
  • Post #30
  • Quote
  • Jan 5, 2022 6:35am Jan 5, 2022 6:35am
  •  StJohns
  • | Joined Jan 2022 | Status: Member | 9 Posts
hi everybody,
this question is not only for analiteg.
I am trying to find a pairs spread deviation indicator since I'd like to try to automate the strategy so I could back-test it. Couldn't find anything like that though.
Any chance guys you could point me to such an indicator? Or give me some formula on how to calculate it?
I guess first one needs to calculate the mean value and then the standard deviation from that mean. Have no idea how to do it.
Thank!
 
 
  • Post #31
  • Quote
  • Jan 5, 2022 7:15am Jan 5, 2022 7:15am
  •  analiteg
  • Joined Dec 2021 | Status: pairs trader | 67 Posts
Quoting StJohns
Disliked
hi everybody, this question is not only for analiteg. I am trying to find a pairs spread deviation indicator since I'd like to try to automate the strategy so I could back-test it. Couldn't find anything like that though. Any chance guys you could point me to such an indicator? Or give me some formula on how to calculate it? I guess first one needs to calculate the mean value and then the standard deviation from that mean. Have no idea how to do it. Thank!
Ignored
Hi!
If I knew how it can be done in MT4 or MT5, I would have done it there. But for calculations, I use python and libraries for data analysis. It's much easier and more reliable that way.

I have several ideas on how to send signals for a deal to an advisor in MT4 or MT5, and there the advisor will open deals. But for now it is in the plans for the future. This implementation requires some resources and time.
In the future, you can even train the neural network to trade using this strategy. But this is a little later.
 
 
  • Post #32
  • Quote
  • Jan 5, 2022 7:36am Jan 5, 2022 7:36am
  •  StJohns
  • | Joined Jan 2022 | Status: Member | 9 Posts
Quoting analiteg
Disliked
{quote} Hi! If I knew how it can be done in MT4 or MT5, I would have done it there. But for calculations, I use python and libraries for data analysis.
Ignored
thanks for a quick reply analiteg!
I know Python. If it's not too much to ask, what libraries do you use to calculate the pair's spread mean and deviation?
 
 
  • Post #33
  • Quote
  • Jan 5, 2022 9:04am Jan 5, 2022 9:04am
  •  analiteg
  • Joined Dec 2021 | Status: pairs trader | 67 Posts
Quoting StJohns
Disliked
{quote} thanks for a quick reply analiteg! I know Python. If it's not too much to ask, what libraries do you use to calculate the pair's spread mean and deviation?
Ignored
pandas, numpy, statsmodel
 
 
  • Post #34
  • Quote
  • Jan 5, 2022 9:36am Jan 5, 2022 9:36am
  •  analiteg
  • Joined Dec 2021 | Status: pairs trader | 67 Posts
Today trades
Buy GBPJPY
Sell USDJPY
Profit +3%
Attached Image (click to enlarge)
Click to Enlarge

Name: USDJPY-GBPJPY.png
Size: 53 KB
 
1
  • Post #35
  • Quote
  • Jan 5, 2022 3:51pm Jan 5, 2022 3:51pm
  •  StJohns
  • | Joined Jan 2022 | Status: Member | 9 Posts
Quoting analiteg
Disliked
Today trades Buy GBPJPY Sell USDJPY Profit +3% {image}
Ignored
great trade man!
3% of the position or account?
 
 
  • Post #36
  • Quote
  • Jan 5, 2022 4:19pm Jan 5, 2022 4:19pm
  •  Merka
  • Joined Jan 2016 | Status: Member | 1,755 Posts
Quoting analiteg
Disliked
Today trades Buy GBPJPY Sell USDJPY Profit +3% {image}
Ignored
could you please show spread gragh to understand how you entered?
 
 
  • Post #37
  • Quote
  • Jan 5, 2022 4:32pm Jan 5, 2022 4:32pm
  •  StJohns
  • | Joined Jan 2022 | Status: Member | 9 Posts
Quoting Merka
Disliked
{quote} could you please show spread gragh to understand how you entered?
Ignored
i think this was the scenario:
Attached Image (click to enlarge)
Click to Enlarge

Name: enterexit.jpg
Size: 156 KB
 
1
  • Post #38
  • Quote
  • Jan 5, 2022 5:42pm Jan 5, 2022 5:42pm
  •  Merka
  • Joined Jan 2016 | Status: Member | 1,755 Posts
Quoting StJohns
Disliked
{quote} i think this was the scenario: {image}
Ignored
Is this the real spread chart related to that trade?
 
 
  • Post #39
  • Quote
  • Jan 5, 2022 7:34pm Jan 5, 2022 7:34pm
  •  StJohns
  • | Joined Jan 2022 | Status: Member | 9 Posts
Quoting Merka
Disliked
{quote} Is this the real spread chart related to that trade?
Ignored
yes, but i don't want to steal the thread, let's hear from analiteg
 
 
  • Post #40
  • Quote
  • Jan 6, 2022 12:42am Jan 6, 2022 12:42am
  •  analiteg
  • Joined Dec 2021 | Status: pairs trader | 67 Posts
Quoting StJohns
Disliked
{quote} great trade man! 3% of the position or account?
Ignored
3% from account.
 
 
  • Trading Journals
  • /
  • Statistical arbitrage and pairs trading on Forex
  • Reply to Thread
    • 1 Page 23456 7
    • 1 Page 234 7
0 traders viewing now
  • More
Top of Page
  • Facebook
  • Twitter
About FF
  • Mission
  • Products
  • User Guide
  • Media Kit
  • Blog
  • Contact
FF Products
  • Forums
  • Trades
  • Calendar
  • News
  • Market
  • Brokers
  • Trade Explorer
FF Website
  • Homepage
  • Search
  • Members
  • Report a Bug
Follow FF
  • Facebook
  • Twitter

FF Sister Sites:

  • Metals Mine
  • Energy EXCH
  • Crypto Craft

Forex Factory® is a brand of Fair Economy, Inc.

Terms of Service / ©2023