• Home
  • Forums
  • Trades
  • News
  • Calendar
  • Market
  • Brokers
  • Login
  • Join
  • 8:14am
Menu
  • Forums
  • Trades
  • News
  • Calendar
  • Market
  • Brokers
  • Login
  • Join
  • 8:14am
Sister Sites
  • Metals Mine
  • Energy EXCH
  • Crypto Craft

Options

Bookmark Thread

First Page First Unread Last Page Last Post

Print Thread

Similar Threads

FX statistical arbitrage 11 replies

Statistical arbitrage position closer required 3 replies

Statistical Arbitrage Trading by EA 34 replies

Statistical arbitrage, hedge, or bluffing myself? 16 replies

statistical arbitrage 1 reply

  • Trading Journals
  • /
  • Reply to Thread
  • Subscribe
  • 43
Attachments: Statistical arbitrage and pairs trading on Forex
Exit Attachments
Tags: Statistical arbitrage and pairs trading on Forex
Cancel

Statistical arbitrage and pairs trading on Forex

  • Last Post
  •  
  • Page 1 23456 7
  • Page 1 234 7
  •  
  • Post #1
  • Quote
  • First Post: Edited Jan 20, 2022 7:35am Jan 3, 2022 2:04am | Edited Jan 20, 2022 7:35am
  •  analiteg
  • Joined Dec 2021 | Status: pairs trader | 67 Posts
Statistical arbitrage

1. About

Statistical arbitrage - is the mispricing of any given security according to its expected value, based on the mathematical analysis of its historical valuations. Statistical arbitrage is often involved with pairs trading.

A statistical arbitrage pairs trading position consists of a long position on one security and a short position on another security. On the forex market, we should open a long position in an undervalued currency pair and a short position in an overvalued currency pair.The profit will get during the moving currency pairs to their mean price.

For trading, we should use pairs with strong correlation and cointegration. Moreover, the change in the distance between these pairs must be stationary.


2. The main idea of the strategy

We must find such currency pairs that move in the same direction and have a strong relationship - correlation.
The correlation coefficient must be greater than 0.9.

Temporary divergences often occur between these currency pairs. The presence of such discrepancies can be identified using the coefficient of cointegration.
It should be no more than 0.05.

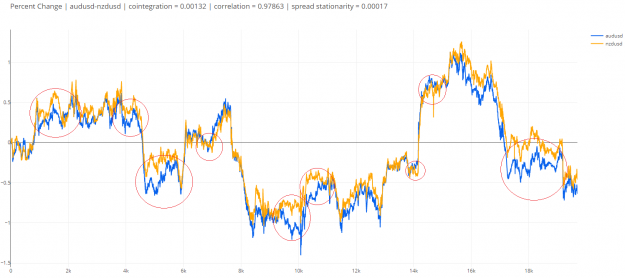
For example, currency pairs audusd and nzdusd. These pairs have strong correlation (0,97) and cointegration (0,00132).
Most of the time, these pairs move in sync, but sometimes there are small price divergences between them, which then quickly level out.

The purpose of the strategy is to find such moments of divergence between pairs and use them in trading.

Attached Image (click to enlarge)
Click to Enlarge

Name: AUDUSD - NZDUSD.png
Size: 92 KB


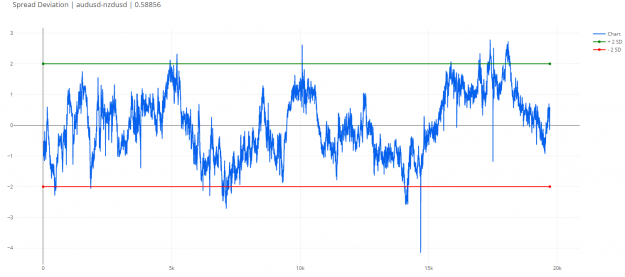
3. How to determine the moment of divergence of currency pairs

To determine the moment of divergence of currency pairs, a synthetic value is used, which is called the spread.

The spread reflects the relative difference between the change in the values of currency pairs. The average value of the spread over a certain period of time is calculated by the linear regression formula using machine learning algorithms.

If the spread value deviates by more than 2 standard deviations up or down from its average value, this is a trade signal.

Attached Image (click to enlarge)
Click to Enlarge

Name: AUDUSD-NZDUSD-SpreadDeviation.png
Size: 75 KB


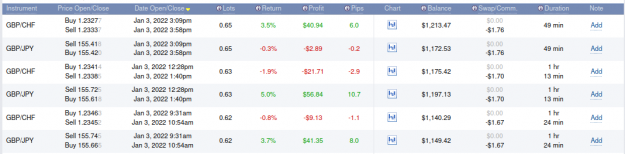
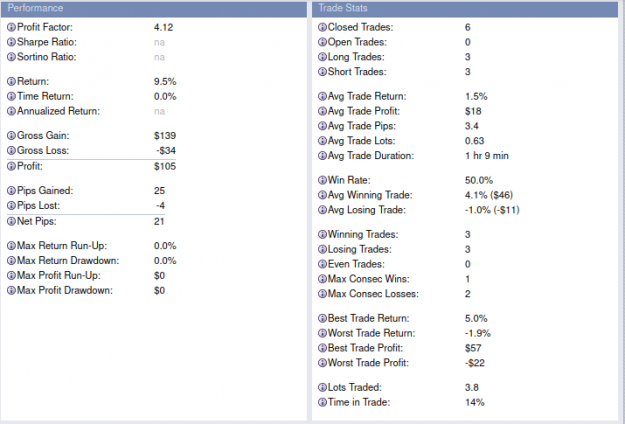
4. Real Time Dashboard

To determine the correlation, cointegration and stationarity of the spread, I use the dashboard. It is free for everyone.

Link: forexpairtrading.com

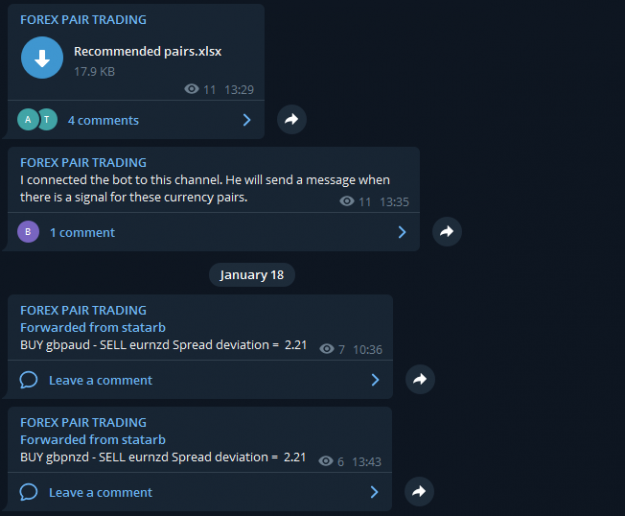
5. Telegram channel with signals

For your and my convenience, I launched a telegram channel.
When a trading signal appears, the bot sends a message to this channel.

LINK to telegram channel

Attached Image (click to enlarge)
Click to Enlarge

Name: Telegram.png
Size: 23 KB


6. YouTube channel

I talk more about this strategy with examples of transactions on my YouTube channel. Subscribe.

Link to my youtube channel.
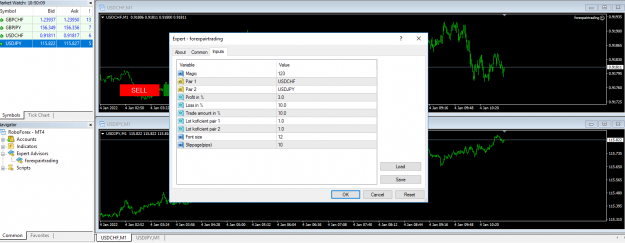
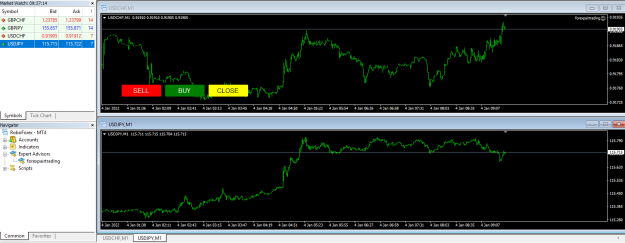
7. Trading panel

To make trades, I use the trading panel for the MT4 terminal.
Open two charts and tile them horizontally. Pair 1 set on top and Pair 2 on the bottom.
Attached Image (click to enlarge)
Click to Enlarge

Name: trade-panel-2.png
Size: 47 KB
Attached Image (click to enlarge)
Click to Enlarge

Name: trade-panel.png
Size: 56 KB

Magic - unique number for orders.
Pair 1 - set Pair 1 name like in your terminal.
Pair 2 - set Pair 2 name like in your terminal.
Profit in % - TP in % from account balance (summary profit from your orders (profit/loss Pair 1 + profit/loss Pair 2 + comissions + SWAP).
Loss in % - SL in % from account balance.
Trade amount in % - this is the position size in the deposit currency. For example, depo is 1000$. Trade amount = 10%. The money size for Pair 1 is 100$, and the money size for Pair 2 is 100$.
Lot coefficient help to tune the total trade amount in $.
Font size is tune letters size on buttons.
Slippage in pips - value for accounts with instant order execution.

Position open
If you want to BUY Pair 1 and SELL Pair 2 - press BUY button.
If you want to SELL Pair 1 and BUYL Pair 2 - press SELL button.
If you want to close positions - press CLOSE button.

Link to trading panel

Link to SET file (recommended settings)


Subscribe to my thread!
  • Post #2
  • Quote
  • Jan 3, 2022 4:14am Jan 3, 2022 4:14am
  •  Mark9999
  • | Joined Feb 2019 | Status: Member | 12 Posts
Nice trading strategy you have. Great work on your website with the charting. I'll keep a close eye on this.

Is it possible to have the hours on the x axis of the charts so we can back test the strategy?

Your comment 'If the p-value is less than 0.05 - these pairs are good for trading' is this the most optimal value you have found for trading these pairs? And when your talking about p-value you mean the percent change difference between pair 1 and pair 2 on your 'Percent Change Chart'?

So at present from the list of pairs that you trade only the 'EURGBP : EURAUD' and 'AUDUSD : GBPUSD' pairs are presently just outside of p-value 0.5. So if they drop to p-value 0.5 or less you would look for standard deviation of 2 or -2 on your spread deviation chart before looking for setup.
 
 
  • Post #3
  • Quote
  • Jan 3, 2022 4:48am Jan 3, 2022 4:48am
  •  lopau
  • | Joined Oct 2008 | Status: Member | 7 Posts
Hi Analiteg,

thanks for opening this thread.

A question: the x-axis in your charts shows numbers in thousands? Would it be possible to show the date/time instead?
 
 
  • Post #4
  • Quote
  • Jan 3, 2022 5:12am Jan 3, 2022 5:12am
  •  analiteg
  • Joined Dec 2021 | Status: pairs trader | 67 Posts
Hi!
This is the number of minutes. I use minutes data for charts and calculations. To use date/time format is inconvenient, because of gaps on charts (weekends and holidays). There are some limitations in the chart engine.
 
1
  • Post #5
  • Quote
  • Jan 3, 2022 5:38am Jan 3, 2022 5:38am
  •  Merka
  • Joined Jan 2016 | Status: Member | 1,759 Posts
Hi
Is it possible to test this approach?
If yes, do you have any historical performances?
The approach you described sound logical and it's mathematical based for numbers lovers
 
 
  • Post #6
  • Quote
  • Jan 3, 2022 5:43am Jan 3, 2022 5:43am
  •  analiteg
  • Joined Dec 2021 | Status: pairs trader | 67 Posts
Quoting Merka
Disliked
Hi Is it possible to test this approach? If yes, do you have any historical performances? The approach you described sound logical and it's mathematical based for numbers lovers
Ignored
Hi!
You can see my trade explorer. I use this strategy.
Now I have described only the idea, a little later I will describe in detail how I trade and what and how I use it.
 
2
  • Post #7
  • Quote
  • Jan 3, 2022 7:06am Jan 3, 2022 7:06am
  •  analiteg
  • Joined Dec 2021 | Status: pairs trader | 67 Posts
Quoting Mark9999
Disliked
Nice trading strategy you have. Great work on your website with the charting. I'll keep a close eye on this. Is it possible to have the hours on the x axis of the charts so we can back test the strategy? Your comment 'If the p-value is less than 0.05 - these pairs are good for trading' is this the most optimal value you have found for trading these pairs? And when your talking about p-value you mean the percent change difference between pair 1 and pair 2 on your 'Percent Change Chart'? So at present from the list of pairs that you trade only the...
Ignored
Hi, Mark.
p-value is statistical value. Two time series are cointegrated if the p-value is less than 0.05.
We should trade only cointegrated pairs.
 
 
  • Post #8
  • Quote
  • Jan 3, 2022 8:08am Jan 3, 2022 8:08am
  •  analiteg
  • Joined Dec 2021 | Status: pairs trader | 67 Posts
My today trades

Attached Image (click to enlarge)
Click to Enlarge

Name: 03-01-2022.png
Size: 830 KB
Attached Image (click to enlarge)
Click to Enlarge

Name: today stats.png
Size: 1.0 MB
 
 
  • Post #9
  • Quote
  • Jan 3, 2022 8:25am Jan 3, 2022 8:25am
  •  Merka
  • Joined Jan 2016 | Status: Member | 1,759 Posts
Quoting analiteg
Disliked
{quote} Hi! You can see my trade explorer. I use this strategy. Now I have described only the idea, a little later I will describe in detail how I trade and what and how I use it.
Ignored
Thanks
 
1
  • Post #10
  • Quote
  • Jan 3, 2022 1:18pm Jan 3, 2022 1:18pm
  •  kofix11
  • | Joined Dec 2011 | Status: Member | 789 Posts
Thanks for this thread. How much spread is allowed for this strategy to make sense? What's your opinion?
 
 
  • Post #11
  • Quote
  • Jan 3, 2022 1:44pm Jan 3, 2022 1:44pm
  •  lopau
  • | Joined Oct 2008 | Status: Member | 7 Posts
Hello Analiteg,

I noticed that you use the same lot size for each pair trade. But shouldn't the lot size be adjusted individually? I noticed that that is normally applied in spread trading strategies.

What is the SL / TP you use in this kind of trading?

And finally, could you include in the dashboard also US30 and US500, as well as futures?

Thanks

Lopau
 
 
  • Post #12
  • Quote
  • Jan 3, 2022 3:19pm Jan 3, 2022 3:19pm
  •  howard
  • | Joined Sep 2006 | Status: howard | 1,681 Posts
Hello Analiteg

In the 2nd step of the process, you mention:

Look at the second chart Spread Deviation.
If, the Spread deviation is greater than 2 wait until it became less than 2. Then, you should SELL Pair2 and BUY Pair1.

Should it not be the other way round? That is if the spread deviation is greater than 2, then sell pair 1 and buy pair 2
Regards
 
 
  • Post #13
  • Quote
  • Jan 4, 2022 12:01am Jan 4, 2022 12:01am
  •  peezy
  • | Joined Jan 2022 | Status: Junior Member | 1 Post
Do we just buy or sell any time them numbers hit like that or is there a strategy to know when to buy or sell inside this idea
 
 
  • Post #14
  • Quote
  • Jan 4, 2022 1:15am Jan 4, 2022 1:15am
  •  analiteg
  • Joined Dec 2021 | Status: pairs trader | 67 Posts
Quoting kofix11
Disliked
Thanks for this thread. How much spread is allowed for this strategy to make sense? What's your opinion?
Ignored
Hi, kofix11!
Which type of spread do you mean? Spread between currency pairs, or spread from your broker?
For good results, it will be good to have a lower spread from your broker. Spread from my broker starts from 0 on major pairs. I can recommend my broker, write me in private messages.
If we talk about the spread between currency pairs, usually I have a profit of 7-10 points.
 
1
  • Post #15
  • Quote
  • Jan 4, 2022 1:19am Jan 4, 2022 1:19am
  •  analiteg
  • Joined Dec 2021 | Status: pairs trader | 67 Posts
Quoting lopau
Disliked
Hello Analiteg, I noticed that you use the same lot size for each pair trade. But shouldn't the lot size be adjusted individually? I noticed that that is normally applied in spread trading strategies. What is the SL / TP you use in this kind of trading? And finally, could you include in the dashboard also US30 and US500, as well as futures? Thanks Lopau
Ignored
I will tell you about lot size, TP, and SL a little bit later.
As for US30 and US500, I plan to include them in some months.
 
 
  • Post #16
  • Quote
  • Jan 4, 2022 1:23am Jan 4, 2022 1:23am
  •  analiteg
  • Joined Dec 2021 | Status: pairs trader | 67 Posts
Quoting howard
Disliked
Hello Analiteg In the 2nd step of the process, you mention: Look at the second chart Spread Deviation. If, the Spread deviation is greater than 2 wait until it became less than 2. Then, you should SELL Pair2 and BUY Pair1. Should it not be the other way round? That is if the spread deviation is greater than 2, then sell pair 1 and buy pair 2
Ignored
No, it is all right.
The spread formula is Spread = Pair2 - x*Pair1.
So if the spread moves from 2 to 0, it means that Pair1 rates grow and Pair2 rates decrease.
 
 
  • Post #17
  • Quote
  • Jan 4, 2022 1:24am Jan 4, 2022 1:24am
  •  analiteg
  • Joined Dec 2021 | Status: pairs trader | 67 Posts
Quoting peezy
Disliked
Do we just buy or sell any time them numbers hit like that or is there a strategy to know when to buy or sell inside this idea
Ignored
Yes, we need a strategy to trade inside this idea. I will tell you about it today.
 
 
  • Post #18
  • Quote
  • Jan 4, 2022 2:39am Jan 4, 2022 2:39am
  •  analiteg
  • Joined Dec 2021 | Status: pairs trader | 67 Posts
Strategy

There are two styles of stat arb trading - scalping and swing.I personally use scalping and recommend it to you. In scalping, you can get 3-5 trades per day. But as for me, 1-2 trades per day is enough.

My settings

Date Range - by default (20 days).

Currency pairs for trades (Pair 1 and Pair 2 respectively):

  1. EURUSD and EURJPY
  2. EURGBP and EURAUD
  3. AUDUSD and GBPUSD
  4. GBPUSD and GBPJPY
  5. GBPCHF and GBPJPY
  6. GBPCHF and GBPUSD
  7. USDCHF and USDJPY
  8. EURUSD and EURCAD
  9. EURUSD and XAUUSD


I prefer major pairs with a lower spread.I start checking these pairs. It is important that p-value should be less than 0.05. Sometimes I admit 0.06.

Spread Deviation

We have borders: 2 and -2. There are standard deviations from the mean. It means that spread usually moves from these borders to the mean. Usually, but not always. We should wait until the spread starts to move from this border to the mean.

For example, if the spread is 2.3, wait until it becomes 1.95 and then SELL Pair2 and BUY Pair1.

Sometimes, the spread can be very high: 3 or -3 and more. In these cases, I usually wait until the spread becomes lower than Spread Deviation MA 20. After this, I open trades.

Positions open

For positions open, I usually use the trading panel for MT4.
This panel automatically opens trades on currency pairs, calculates lot size, and automatically closes trades.

Attached Image (click to enlarge)
Click to Enlarge

Name: panel.png
Size: 47 KB
Attached File(s)
File Type: zip forexpairtrading.zip   18 KB | 410 downloads
 
1
  • Post #19
  • Quote
  • Jan 4, 2022 4:25am Jan 4, 2022 4:25am
  •  analiteg
  • Joined Dec 2021 | Status: pairs trader | 67 Posts
How to use the panel

Open two charts and tile them horizontally. Pair 1 set on top and Pair 2 on the bottom.

Settings

Magic - unique number for orders.
Pair 1 - set Pair 1 name like in your terminal.
Pair 2 - set Pair 2 name like in your terminal.
Profit in % - TP in % from account balance (summary profit from your orders (profit/loss Pair 1 + profit/loss Pair 2 + comissions + SWAP).
Loss in % - SL in % from account balance.
Trade amount in % - this is the position size in the deposit currency. For example, depo is 1000$. Trade amount = 10%. The money size for Pair 1 is 100$, and the money size for Pair 2 is 100$. Panel calculates which lot size you can open for Pair 1 on 100$ with leverage 1:100. For USDJPY panel opens 0.1 lot.
Lot coefficient help to tune the total trade amount in $. For example, if lot coefficient pair1 = 1.1 it means that the money size for Pair 1 is 100$*1.1 = 110$ and lot size is 0.11 lot.
Font size is tune letters size on buttons.
Slippage in pips - value for accounts with instant order execution.

Position open

If you want to BUY Pair 1 and SELL Pair 2 - press BUY button.
If you want to SELL Pair 1 and BUYL Pair 2 - press SELL button.
If you want to close positions - press CLOSE button.

My settings


  1. Profit in % = 3
  2. Loss in % = 15
  3. Trade amount in % = 10
  4. Lot coefficient pair1 = 1
  5. Lot coefficient pair2 = 1
  6. Account leverage = 1:1000

The panel automatically closes positions when total profit is greater than 3% from the account balance or total loss is greater than 15%. I use SL as a defense against unforeseen situations. If you got an SL it means that you have made something wrong in your analysis.

Attached Image (click to enlarge)
Click to Enlarge

Name: panel 2.png
Size: 56 KB
 
 
  • Post #20
  • Quote
  • Jan 4, 2022 9:07am Jan 4, 2022 9:07am
  •  howard
  • | Joined Sep 2006 | Status: howard | 1,681 Posts
Quoting analiteg
Disliked
{quote} No, it is all right. The spread formula is Spread = Pair2 - x*Pair1. So if the spread moves from 2 to 0, it means that Pair1 rates grow and Pair2 rates decrease.
Ignored
Thanks for clarification, I thought the formula was
Spread= Pair1-x*Pair2
Regards
 
1
  • Trading Journals
  • /
  • Statistical arbitrage and pairs trading on Forex
  • Reply to Thread
    • Page 1 23456 7
    • Page 1 234 7
0 traders viewing now
  • More
Top of Page
  • Facebook
  • Twitter
About FF
  • Mission
  • Products
  • User Guide
  • Media Kit
  • Blog
  • Contact
FF Products
  • Forums
  • Trades
  • Calendar
  • News
  • Market
  • Brokers
  • Trade Explorer
FF Website
  • Homepage
  • Search
  • Members
  • Report a Bug
Follow FF
  • Facebook
  • Twitter

FF Sister Sites:

  • Metals Mine
  • Energy EXCH
  • Crypto Craft

Forex Factory® is a brand of Fair Economy, Inc.

Terms of Service / ©2023