My understanding was that the levels are chosen based on the assumption that price does a random walk. With a random walk you expect the maximum excursion from the day open price to expand as sqrt(t), hence the indicator shown in post #7.
To verify that assunption, I analysed the EURUSD M5 bars of the last two years. Graphs use percentiles instead of averages to better filter out noise due to extreme outliers. Between yellow and green is 1 sigma, between red and blue is 2 sigma.
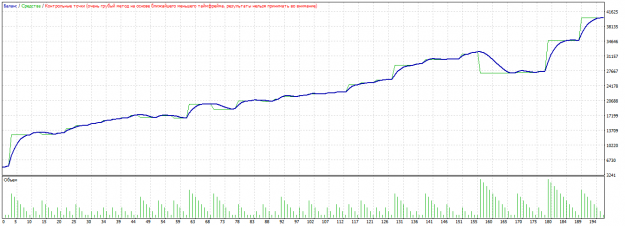
First I calculated where the current relative price was during the day:
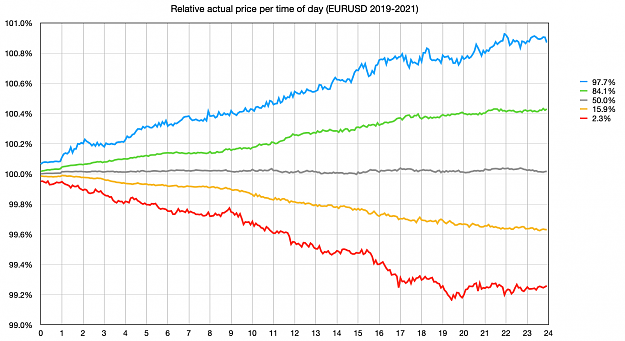
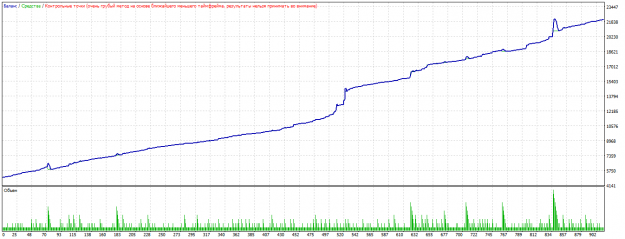
As you can see, this does not look like sqrt(t) at all. Next I calculated the maximum excursion from the daily open price:
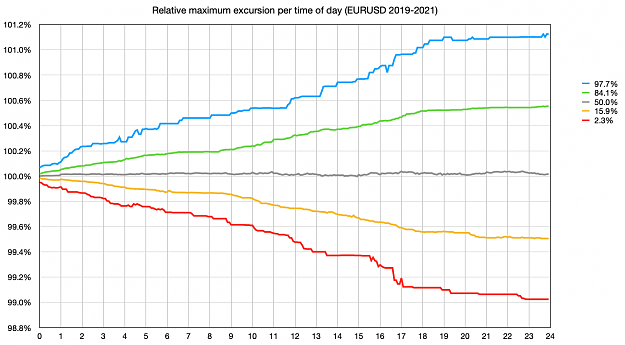
Apparently the EURUSD is not likely to make a new high/low after 19:00 when the curve flattens, but again no sqrt(t) profile.
Can someone explain why sqrt(t) is used?
To verify that assunption, I analysed the EURUSD M5 bars of the last two years. Graphs use percentiles instead of averages to better filter out noise due to extreme outliers. Between yellow and green is 1 sigma, between red and blue is 2 sigma.
First I calculated where the current relative price was during the day:
Attached Image (click to enlarge)
As you can see, this does not look like sqrt(t) at all. Next I calculated the maximum excursion from the daily open price:
Attached Image (click to enlarge)
Apparently the EURUSD is not likely to make a new high/low after 19:00 when the curve flattens, but again no sqrt(t) profile.
Can someone explain why sqrt(t) is used?