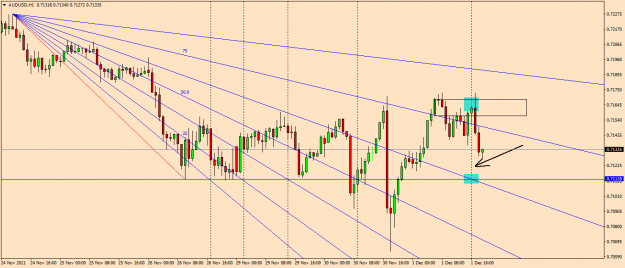
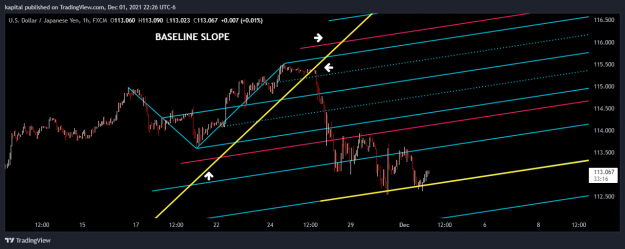
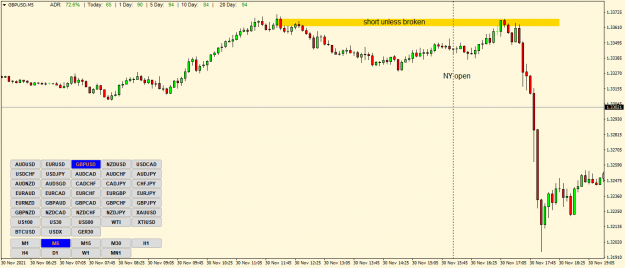
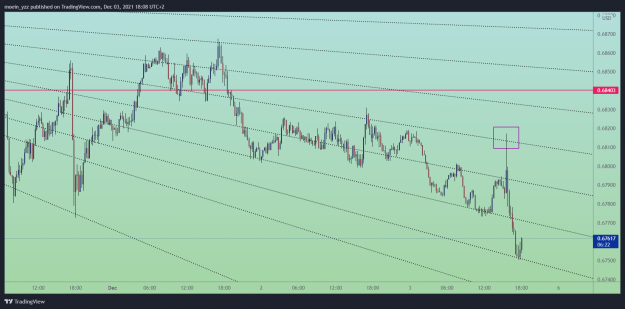
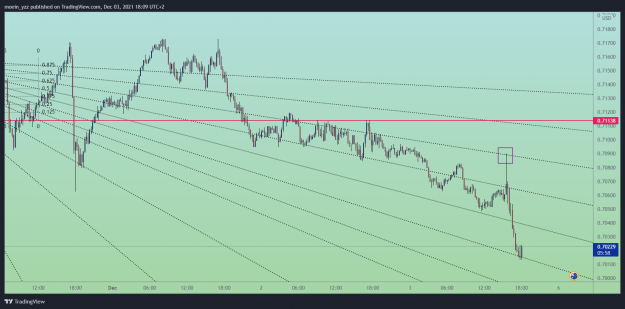
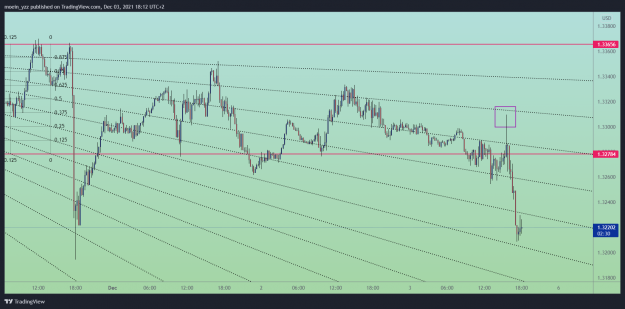
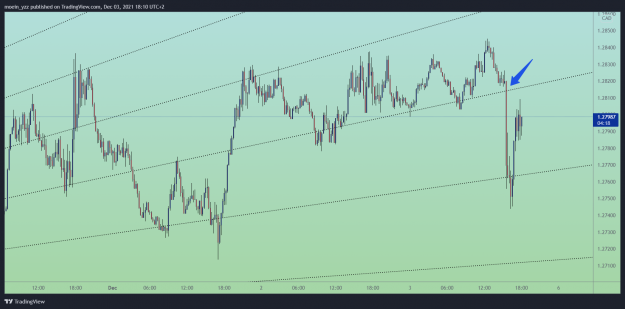
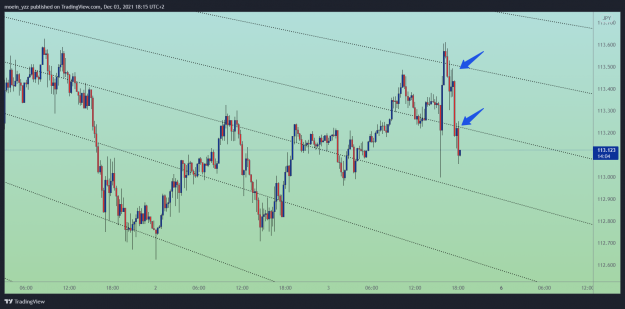
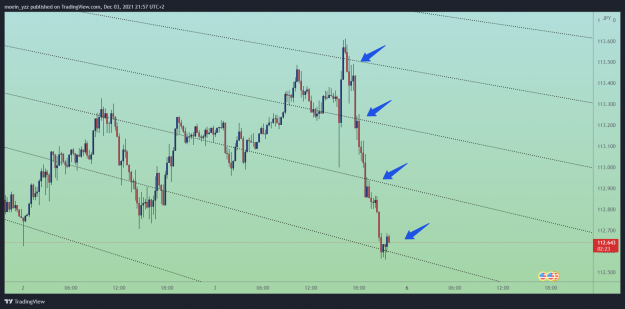
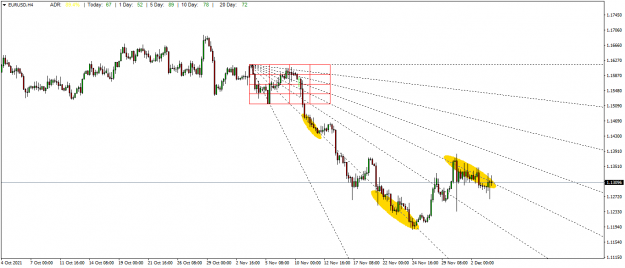
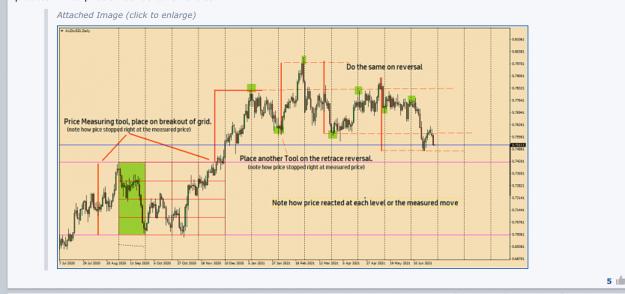
Disliked{quote} I will open the chart up to see better. I only use this on the daily chart as a potential entry. The concept is taken from ICT who trades this method on every time frame, but I only use it as a guage on the daily...The concept is simple, wherever there is a change in direction there is usually a pump candle closing green (or vise versa on a change to long) at the top of the range, the next candle falls hard indicating a change in direction, the subsequent candles will come back and test the area....that is the entry...the retest. {image}...Ignored
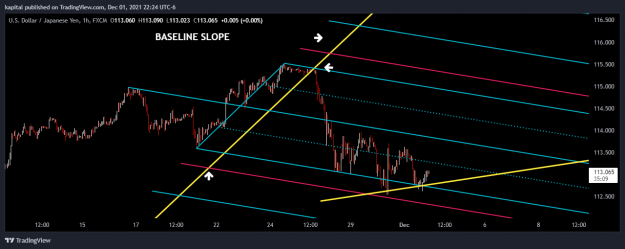
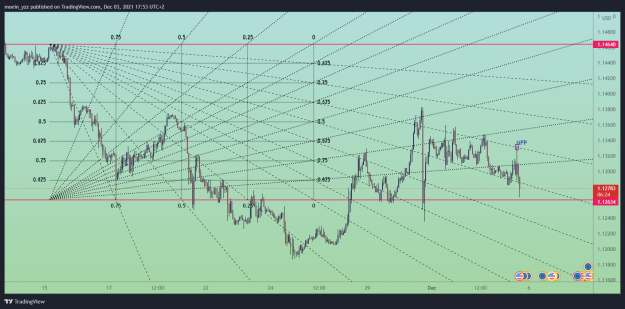
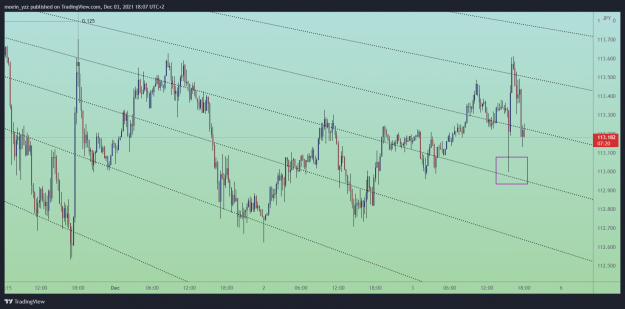
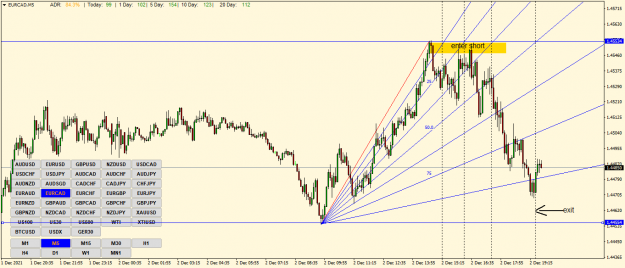
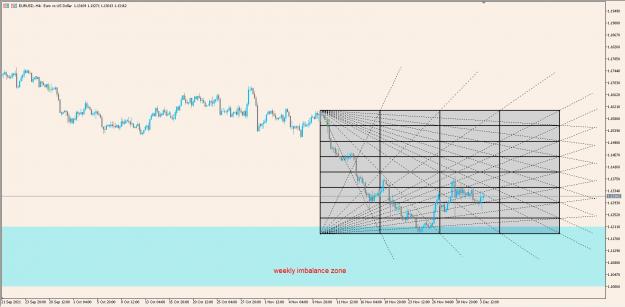
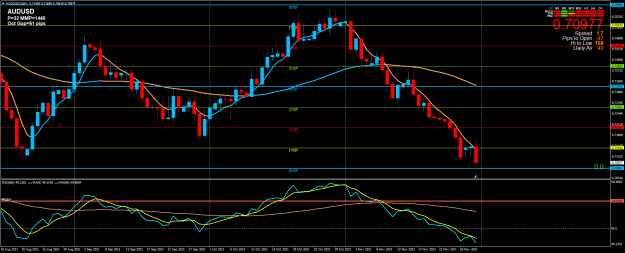
Here is the Bar Pattern set within
My Pivot Calculator Grid
Attached Image (click to enlarge)
1