{quote} Swede Hope you do not mind but here would be my view {image}
Ignored
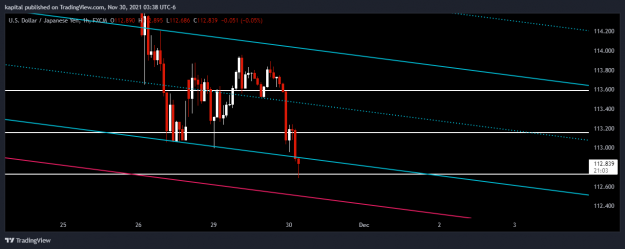
I have a feeling this is some kind of turning point....just intuition though, but it’s not hard to see USDX is in retreat.
(and another strain of covid coming out of Africa is just not good news atm). Sue and I have a cruise leaving Southampton in May, destined for St. Petersburg....but not holding my breath...Maybe we will just fly from Calgary and enjoy Britain for a couple weeks....never been to Scotland or Ireland so that would be a good alternative.
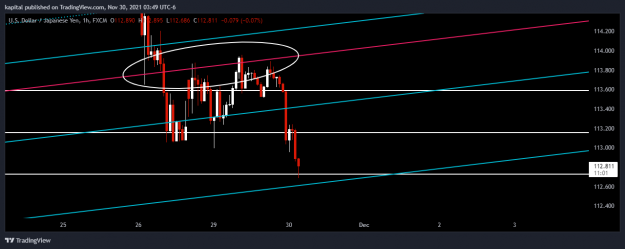
Probably some of the younger or newer traders have never heard about this pattern or where it came from...well, they know it by other names but Bill Wolfe is the originator of the Wolfe Wave....and they work with such precision ...anyway, it was time for Cad and USDX was the trigger...
ps...as you can see my example was not a true Wolfe Wave, more like a Gartley, but these patterns can have stupendous results if the trader can sit on his hands until the pattern completes.
edit...your probably wondering why post this pattern now...well, have a close look at the diagonals from key points and realize the turning points are structured, the pattern is structured thus making the diagonals very precise....both for entries and targets
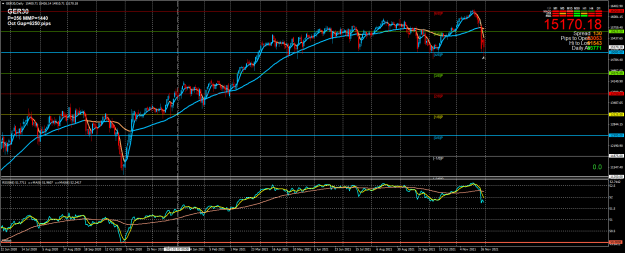
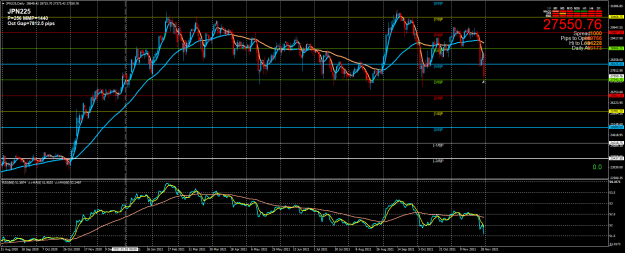
I can only say WOW Seems I made a right mess of my Sell from 16250 exit @ 15825 {image} {image} {image}
Ignored
Well, your only human, who knew there would be such a strong reaction today.....honestly, the world is nervous again, volatility will be strong the next few days...
Now, how was the exit further showing confluence....by one more step if you want to estimate WHEN to exit....pretty precise I would say and 58 pips in the bank on a counter trend trade..... during a highly short market
Quite curious how those lines work and what your 2 cents are saying parisboy lol. I myself rarely had good experience learning or trading with MAs. Kinda my weak spot as one would say.
Ended up shorting at the break of the diagonal 2 hours after NY open.
Out now at ADR low.
What's your preference regarding the session opens? How long do you usually wait after an open? Or it's all relative and depending on the sentiment and etc?
{quote} Quite curious how those lines work and what your 2 cents are saying parisboy lol. I myself rarely had good experience learning or trading with MAs. Kinda my weak spot as one would say.
Ignored
Its a complete study and method in itself...envelopes with setbacks....go to his forum envelopes where it is explained extensively. He is a very good trader with extensive experience..
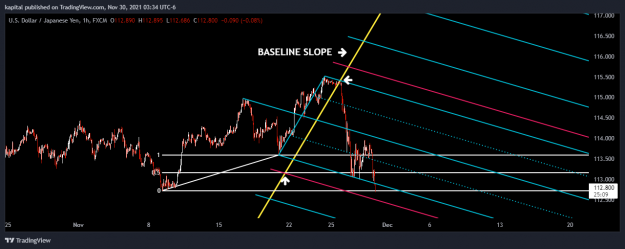
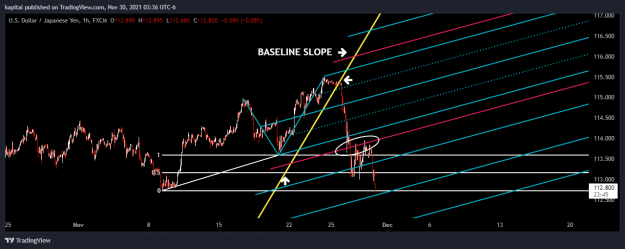
Look for a potential reaction (support or catalyst for further movement downward) at the bottom purple sliding parallel of the regular pitchfork due to the resistance met at the bottom purple sliding parallel of the modified schiff pitchfork.
Attached Image(s) (click to enlarge)
"GIVE ME 3 POINTS IN SPACE IN TIME AND WATCH ME CREATE MAGIC."
Swede
I like the left side chart of your post
Guys ought to really look what you are showing
In fact I was trying to find the similar one you posted a while back yesterday
Simple, Constant and Set Rules for Entries and Exits combined with good Money Management
ps
I would still add my Pivot Calculator though as an aid
{quote} Swede I like the left side chart of your post Guys ought to really look what you are showing In fact I was trying to find the similar one you posted a while back yesterday Simple, Constant and Set Rules for Entries and Exits combined with good Money Management ps I would still add my Pivot Calculator though as an aid HaHaaaaaaaaaaaaaaaa (update) {image} {image}
Ignored
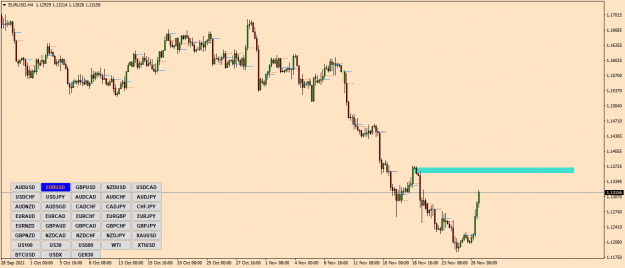
I will open the chart up to see better. I only use this on the daily chart as a potential entry. The concept is taken from ICT who trades this method on every time frame, but I only use it as a guage on the daily...The concept is simple, wherever there is a change in direction there is usually a pump candle closing green (or vise versa on a change to long) at the top of the range, the next candle falls hard indicating a change in direction, the subsequent candles will come back and test the area....that is the entry...the retest.
ps....if anyone wants to experiment with this method, make sure the reverse candle breaks the range and closes accordingly, before the potential is valid.
{quote} I will open the chart up to see better. I only use this on the daily chart as a potential entry. The concept is taken from ICT who trades this method on every time frame, but I only use it as a guage on the daily...The concept is simple, wherever there is a change in direction there is usually a pump candle closing green (or vise versa on a change to long) at the top of the range, the next candle falls hard indicating a change in direction, the subsequent candles will come back and test the area....that is the entry...the retest. {image}...