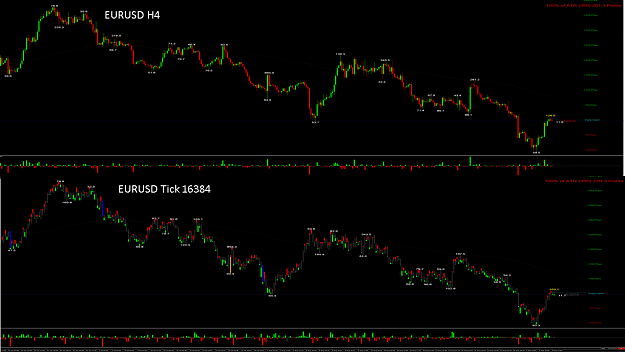
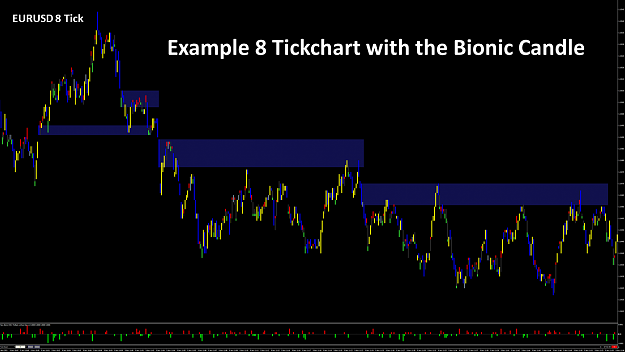
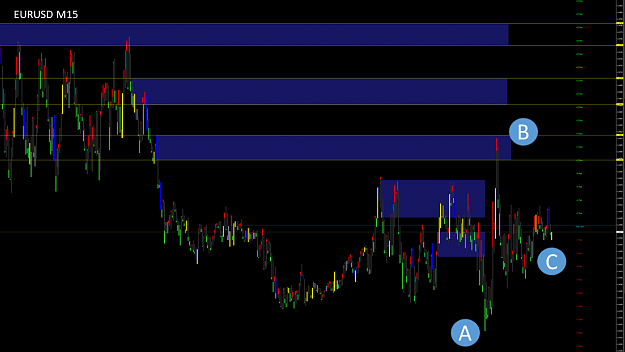
• Home
  • Forums
  • Trades
  • News
  • Calendar
  • Market
  • Brokers
  • Login
  • Join
  • 2:17pm
Menu
  • Forums
  • Trades
  • News
  • Calendar
  • Market
  • Brokers
  • Login
  • Join
  • 2:17pm
Sister Sites
  • Metals Mine
  • Energy EXCH
  • Crypto Craft

Options

Bookmark Thread

First Page First Unread Last Page Last Post

Print Thread

Similar Threads

Easy chart navigation and EA overview (req) 0 replies

Jump to date with navigation window issue 2 replies

Simplest and easiest trading strategy 11 replies

Why does GBPUSD enjoy the biggest/easiest price moves? 7 replies

  • Trading Systems
  • /
  • Reply to Thread
  • Subscribe
  • 451
Attachments: Bionic Chart - The easiest forex navigation
Exit Attachments
Tags: Bionic Chart - The easiest forex navigation
Cancel

Bionic Chart - The easiest forex navigation

  • Last Post
  •  
  • 1 1718Page 192021 47
  • 1 18Page 1920 47
  •  
  • Post #361
  • Quote
  • Nov 10, 2021 7:09pm Nov 10, 2021 7:09pm
  •  lpp
  • | Joined Jul 2008 | Status: Persona Non Grata | 126 Posts
Quoting Bionics
Disliked
{quote} {image} Hello Lorne, welcome to our place. The basic colors of the Bionic Candle are set on your chart, which you can change at any time in the settings. We are looking forward to your feedback. Greetings Michael
Ignored
Thank you Michael,
I've downloaded the current indicators and template.It certainly allows the videos and my charts to be in sync.

My 1st post was somewhat premature but your (2 threads) instruction has been very enlightening for me.

Onward and upward.

Regards
Lorne
I would like to die on Mars. Just not on impact..... Elon Musk
 
1
  • Post #362
  • Quote
  • Nov 10, 2021 8:22pm Nov 10, 2021 8:22pm
  •  pelud
  • | Joined Jan 2021 | Status: Member | 6 Posts
Hi Michael, thanks for your efforts. Definitely the tick chart can make the difference in trading I think. When I read it a minute ago it seems like all make sense to me. I’ll be easier to identify the key candle this way and reduce risk and therefore improve win ratio. But how can I configure my MT4 to actually show 8 tick charts? Is that possible?
thanks Michael
 
1
  • Post #363
  • Quote
  • Nov 11, 2021 12:14am Nov 11, 2021 12:14am
  •  Bionics
  • Joined Dec 2017 | Status: //houston ǝʍ have a probl | 2,239 Posts
Quoting lpp
Disliked
{quote} Thank you Michael, I've downloaded the current indicators and template.It certainly allows the videos and my charts to be in sync. My 1st post was somewhat premature but your (2 threads) instruction has been very enlightening for me. Onward and upward. Regards Lorne
Ignored
Hello Lorne, when someone comes into a thread for the first time, it is completely normal that everything is something new and unfamiliar. One don't know what it's about and how the respective system works. For this reason I have created a kind of guide on the first page so that everyone can find their way around. I am happy if this introduction helped you. Greetings Michael
Forget: "That does not work," amateurs build the ark, pros the Titanic!
 
 
  • Post #364
  • Quote
  • Nov 11, 2021 12:15am Nov 11, 2021 12:15am
  •  Bionics
  • Joined Dec 2017 | Status: //houston ǝʍ have a probl | 2,239 Posts
Important message to everyone visiting our thread for the first time.

First of all, we are pleased that you would like to take part in this exciting exchange. So that you get the most important basics, please have a look at my first post in the interest of all members:

https://www.forexfactory.com/thread/...rex-navigation

Thank you and we look forward, to a constructive exchange with you. Greetings Michael
Forget: "That does not work," amateurs build the ark, pros the Titanic!
 
 
  • Post #365
  • Quote
  • Nov 11, 2021 12:15am Nov 11, 2021 12:15am
  •  Bionics
  • Joined Dec 2017 | Status: //houston ǝʍ have a probl | 2,239 Posts
Quoting pelud
Disliked
Hi Michael, thanks for your efforts. Definitely the tick chart can make the difference in trading I think. When I read it a minute ago it seems like all make sense to me. I’ll be easier to identify the key candle this way and reduce risk and therefore improve win ratio. But how can I configure my MT4 to actually show 8 tick charts? Is that possible? thanks Michael
Ignored
Hello pelud, thank you very much and welcome to our thread. The tickchart is a useful addition to the bionic candle, which is why we started this tickchart project yesterday. In the next few days, all of your questions will be answered as we go deeper into the tick charts and deal with them very intensively. Greetings Michael
Forget: "That does not work," amateurs build the ark, pros the Titanic!
 
1
  • Post #366
  • Quote
  • Nov 11, 2021 4:13am Nov 11, 2021 4:13am
  •  funte
  • | Joined Mar 2021 | Status: Member | 6 Posts
Quoting Bionics
Disliked
{quote} Hello Jan, a warm welcome to you too and thank you for your compliment. On the first page I posted 6 videos that include extensive explanations. You will also find the German text in the form of a PDF file under these videos. I hope that this will help you. I am glad that you are there. Greetings Michael
Ignored
Hey Michael and hello to the others :-)

yes, I watched them twice and I'm still learning and trying to figure it out while trading :-D.
Today I took that trade successfully:

Attached Image (click to enlarge)
Click to Enlarge

Name: EURUSD Trade 3.PNG
Size: 25 KB

My explanation: The price was rejected twice from the candle on the left with the turquoise zone. Then the Price broke through, got rejected and dropped from the key candle, where I marked the gray zone. Price entered that gray zone again, I entered with a tight stop and the price was rejected quickly and hit my tp.

Open to feedback anytime since I'm still learning :-).

Have a great trading day everyone!
 
1
  • Post #367
  • Quote
  • Nov 11, 2021 4:13am Nov 11, 2021 4:13am
  •  Bionics
  • Joined Dec 2017 | Status: //houston ǝʍ have a probl | 2,239 Posts
Bionic candle on the tick chart


Hello dear Bionic Traders,


As already announced, today we will deal more closely with the tick charts, which give us the opportunity to identify the invisible price zones of the big players even more precisely. First of all, a tick is nothing more than a price change, but we will now take a closer look at how a tick is created.

Attached Image (click to enlarge)
Click to Enlarge

Name: Folie1.PNG
Size: 125 KB

We see here on the left a DoM (deep of market), which basically shows the origin of the price movement. On the right side is the time and sales list that shows us the incoming market orders.

Point A
Here we see the price ladder in the DoM.

Point B
This is where the limit buy orders placed in the market are located, waiting for market sell orders to be activated.

Point C
Here we see the cumulative number of 10 levels of limit buy orders on the bid side. However, my stock market data feed allows me to see an unlimited number of limit levels.

Point D
On the ask page we see the cumulative number of ten levels of limit sell orders.

Point E
This is where the limit sell orders are in the market, waiting for a market buy order to be activated.

Point F
The price is currently at the Best Ask level at 1.10060.

Point G
At 10:00:18 a.m., 10 lot market buy orders enter the market.

Point H
These now appear on the Ask page in the DoM and fill the 30 Lot Limit Sell Orders. The customers who have placed these limit sell orders stand in a kind of queue in the cathedral. Whoever came first is also carried out first. This is a nice theory, but it is not entirely true, as certain big players in the queue have priority. However, that should not be the topic today.

Attached Image (click to enlarge)
Click to Enlarge

Name: Folie2.PNG
Size: 127 KB

Point A
First of all, we see that on the Limit Sell page 10 limit sell orders have been reduced because 10 lot market buy orders have entered there. There was no price change during this promotion because the promotion took place at the best ask price, where the price was already before.

Point B
At the same time we see that 10 lots have now been reduced in the area of limit sell orders. Of course, in spoofing by pulling or stacking, further orders can be added or removed at any time.

Point C
At the end we see that there are no more market buy orders on the ask side.

Point D
2 seconds later, 10 Lot Market Sell Orders enter the market.

Point E
These appear in the DoM and fill the limit buy orders at Point G.

Point F
At the same time, the price jumps from the best ask page to the best bid page. However, at this moment the best ask price is still at 1.10060. Although 10 lot market buy orders and 10 lot market sell orders have just entered the market, there was only a tad of movement as the price fell from level 1.10060 to level 1.10055. So you realize that a tick change has nothing to do with the number of volume. It is important to know that the individual market orders that enter the time and sales list are processed one after the other. As a rule, the price only fluctuates between the best ask and best bid price until a limit level is reduced. Then the price jumps over the Best Ask or Best Bid level.

Attached Image


Here you can once again see examples of different price changes and the process in the DoM in my animated gif for you. I understand that most forex participants do not have this information, but these basics are important in understanding how a tick is created. Unfortunately we only have 9 different time units in MT4, of which a scalper has to get the most out of an M1 or M5 candle. This is a relatively large range that provides very little information, especially in the short term. In addition, the information within an M1 is very poor and not very meaningful. With a tick chart we have the chance to break down the prices of the forex market better, which most traders who work in a normal time chart cannot see. This makes it easier, especially as a scalper, to identify resistance zones more efficiently and quickly. In addition, we can optimize and change our time units in ticks within the tick chart at any time.

Attached Image (click to enlarge)
Click to Enlarge

Name: Folie4.PNG
Size: 130 KB

In the picture we are comparing the EURUSD H4 with the EURUSD on a 16384 tick chart. The main advantage of a tick chart is the resolution of the individual candles. When volatility is low, fewer candles are formed. With a high volatility, significantly more candles are formed, which simplifies the overview and the drawing of resistances. So if little happens in the market, there are fewer candles. If there are strong movements in the market, more candles are formed in the tick chart, which means that the strong movements can be analyzed in more detail. In the event of an outbreak, a strong candle in the M1 will be of no use to you. With a tick chart, you can even get 30 candles instead of one candle and thus better identify the crucial resistances.

Attached Image (click to enlarge)
Click to Enlarge

Name: Folie5.PNG
Size: 39 KB

We see an M1 chart in EURUSD. 17 candles are formed within 17 minutes. For a scalper, this is relatively little information with which he can actually do nothig.

Attached Image (click to enlarge)
Click to Enlarge

Name: Folie6.PNG
Size: 33 KB

We now create a 64-tick chart and get 25 instead of 17 candles over the same period. That is already 50% more information.

Attached Image (click to enlarge)
Click to Enlarge

Name: Folie7.PNG
Size: 41 KB

42 candles are already created in a 32 tickchart. That's 150% more information.

Attached Image (click to enlarge)
Click to Enlarge

Name: Folie8.PNG
Size: 48 KB

The 16 tick chart already shows 92 candles within 17 minutes. The moving average EMA 200 is much more accurate than in the M1. Personally, I do not work with an MA, the information is only intended as an example.

Attached Image (click to enlarge)
Click to Enlarge

Name: Folie9.PNG
Size: 66 KB

For me, the T08 is the smallest unit of time within a tick chart that you can still work with. While 17 candles are displayed in the M1, the T 08 already shows 187 candles. That's 11 times more information. This information is much more meaningful to a scalper and makes it easier to create resistance zones. If the volatility in the morning is still very low, you can work well with a T08. If the volatility rises sharply in the afternoon, you can relatively easily increase the number of ticks displayed.

Attached Image (click to enlarge)
Click to Enlarge

Name: Folie10.PNG
Size: 96 KB

Here we see the difference between M1 and T08. As a scalper, I work most of the time in the tick chart with the T08, T16, T32, T64, T128, T256 and T512. With one click, I can double or halve the tick units without leaving or changing the offline chart. To get a bigger overview, it is no problem to switch to higher tick units like the T16384. In combination with the Bionic candle, I can determine resistance zones relatively easily, and also reduce them. A tick is caused by a price change in Forex, which means that I am closer to the actual resistance zones with a tick chart than with any other unit of time. The disadvantage is that a tickchart is not time-oriented like the M1. However, I don't care about time or price. In the forex market, I focus on my keycandle resistance zones. This information should first bring you closer to the advantages of a tickchart. Tomorrow we will talk about how you can integrate such a tickchart into your MT4, what differences there are between different providers and what you should pay attention to. If the information helped you, I look forward to your feedback.

I wish you all the best for today

Greetings Michael
Forget: "That does not work," amateurs build the ark, pros the Titanic!
 
5
  • Post #368
  • Quote
  • Nov 12, 2021 1:32am Nov 12, 2021 1:32am
  •  cinalex
  • | Joined Oct 2015 | Status: Member | 46 Posts
Thank you for the knowledge. I really need to increase the size of my monitors,
 
1
  • Post #369
  • Quote
  • Nov 12, 2021 1:59am Nov 12, 2021 1:59am
  •  Bionics
  • Joined Dec 2017 | Status: //houston ǝʍ have a probl | 2,239 Posts
Different tick charts with the Bionic candle


Hello dear Bionic Traders,


In the last few years I have worked with different tick charts. I would now like to show you the results in detail. A tick chart only runs in offline mode in MT4, which means that a corresponding indicator fetches the tick data from the respective broker and emulates a new chart from it. There are free tick charts at Forex Factory that also work perfectly. The problem with creating a tick chart is to first determine the tick size, for example 8 ticks. Then you create a new chart in offline mode, which now shows us these 8 tick candles. Then you can insert the Bionic candle and work with it. However, the candles only start to be displayed at the moment when this offline chart is called up. With that you don't see any candles in the past, of course. Another problem is that you only see the 8 tick candles in this offline chart. Switching to another tick unit is not possible. Now you could emulate different tick charts, but this puts a massive strain on the MT4, depending on how many millions of candles are stored. Another disadvantage, if you have drawn several resistance zones on a tick chart and now call up a new chart, you can no longer see these zones. At least that was the case a few years ago, I don't know whether there are already other tick charts at Forex Factory. For this reason, I tested and tried out different, chargeable tick charts at the time. In the end, there were two paid versions that I would like to share my experience about. However, I would like to emphasize at this point that I do not want to advertise any of these tick charts and that I will not receive any money for this information. I'm not in the commercial field, only trader. It is also possible that there are far better tick charts, but at the time I had to make a decision to choose a tick chart.

Attached Image (click to enlarge)
Click to Enlarge

Name: Folie1.PNG
Size: 540 KB

In the end, I had a choice between Rainwoods and OVO. Each of these tick charts has advantages and disadvantages and I will try to describe how these tick charts are set up. Basically, you can say that both tick charts achieved equally good results.

Rainwoods Tick chart

The indicator costs $ 59 for an unlimited license, but there is no description of whether there is a limitation on the trading account and whether this license can be run on different computers. There is also no demo version, which means you have to start with the paid version immediately. The installation was a little more complicated than with the OVO. When you call up the indicator, you had to enter two previously sent passwords within 30 seconds, otherwise the indicator would close again. The selection of the tick data is much better than with the OVO, you can load tick data without history, generate tick data from the M1 and download tick data from a third party. It is not explained which third party provider is involved. Depending on the period of the tick data, this download may take some time. A 60 tick chart of the last 2 weeks took a total of 5:47 minutes on a 100 Mbit line at the weekend. Unfortunately, the third-party tick data was not as accurate as my broker's tick data, which tarnished the advantage a bit. The tick charts can be displayed directly below the M1 chart and / or in the offline chart. A clear advantage over OVO, but changing to a different tick size is very cumbersome and takes longer than with the OVO. Likewise, installing a second tick chart on the same screen is very confusing and complicated. The performance suffers significantly when multiple charts are open. Interesting: There are many additional tools that are not available at OVO. All indicators can be used in the offline chart.

Attached Image (click to enlarge)
Click to Enlarge

Name: Folie3.PNG
Size: 107 KB

OVO tick chart

There is a demo version that you can try for free for 2 weeks, then an unlimited license costs 49 US dollars. This license is for 3 Windows accounts and there is no limit to the number of open windows within these accounts. In theory, if you split the three accounts, 3 merchants could pay $ 16 to access it. There is a free indicator that optimizes the offline chart. The tick data is generated from the broker's data; unfortunately, third-party tick data does not exist. If you call up the tick chart in the morning, there are sometimes candles of the same size in previous courses that look like a Renko chart. We also noticed this with Rainwood, but you can also download the data from the third party there to work around this problem. As soon as the tick chart starts to run, the tick data is drawn correctly on the Rainwood and OVO. The decisive factor here, however, is which tick data your broker delivers. With the free Omnia Remote indicator you can change the number of ticks in the offline chart very quickly. With one click the number of ticks doubles, whereby you can also set any value. Installing a second tick chart on the same screen is much easier than with the Rainwood. Performance in OVO does not suffer when multiple charts are open.

Attached Image (click to enlarge)
Click to Enlarge

Name: Folie2.PNG
Size: 153 KB

An average day in EURUSD contains around 92,160 ticks. On average, that's 64 ticks per minute. If you were to convert the known time units from M1 to MN into ticks, this would result in 15,360 ticks for the 4 hour chart, for example. Entering these numbers over and over again was very stressful for me. There is a little trick here, though. In the remote control from OVO there is an arrow to the right and left of the specified number. If you press the right arrow, the number of entered numbers is doubled and if you press the left arrow, the value shown there is halved. If you now start with the value 4 and keep pressing the right arrow, you get very close to the known time units. In the right table you can see the number of ticks and the time units translated for them. However, we have to be aware that we are saying goodbye to time-based units with a tickchart. Accordingly, the time units known to us are no longer so decisive there.

Conclusion

Both indicators generate very good tick charts, although there were differences here too. However, it cannot be determined which indicator is ahead, as there is no precise reference value. The Rainwood offers a third party tick data, if you have a broker that offers insufficient data, the Rainwood is the first choice. On the other hand, handling the OVO is easier and the performance suffers significantly less. That's why I chose the OVO, although it cannot be said that it is better than the Rainwood. Both indicators have their strengths and weaknesses. It's like Mercedes and BMW, both are excellent vehicles, but I chose the Mercedes because for me it offers more advantages than the BMW. Nevertheless, the BMW is the first choice for many others. It is crucial that one product offers you more advantages than another. A big advantage for OVO is that you can test it for 2 weeks free of charge. If you don't find an advantage then you haven't lost any money. I once made an interesting experiment with the OVO tick chart. I wanted to display the first 24 Fibonacci numbers from 1 to 75025 as 24 different tick charts in one chart image and see how that affects my performance. The basis was my bionic chart and another indicator. There were no problems with that.

Inserted Video


You can find the test here


In an online chart, you can also emulate a seconds chart in MT4. It doesn't matter whether you want to display a 5 or 8 seconds chart. The disadvantage of a seconds chart is again time-based (the best information is always obtained in non-time-based charts) and if you draw resistance zones, you cannot change the time unit to make the zones smaller. In addition, a tick chart shows the crucial strong zones more clearly. Here you can find a test between a 10 seconds chart and a 12 tick chart.

Inserted Video


In order to use the tick charts efficiently, I work with a VPS server on which my tick charts run 24 hours a day. This means that I do not need any data from a third party, but can work with the exact tick data from my broker. VPS servers with Windows cost four times as much as a VPS server with Linux. Linux is much faster, which is proven by the fact that 50% of all Microsoft servers run on Linux. If you want to work with a Linux server, you need special knowledge when setting up the server. It is also not very easy for a layperson to get the MT4 up and running under Linux. The server should have at least 6-8 vCPU cores, 16-32 GB RAM, an NVMe storage unit, and a fast connection. However, this is only my personal requirement. A little tip on the side: Find a professional hoster for your VPS server who has experience with traders. You now have to decide for yourself, which Tick Chat is best for you. You can find the providers via Google.

I hope that I was able to help you a little and keep my fingers crossed for you.

Kind regards Michael
Forget: "That does not work," amateurs build the ark, pros the Titanic!
 
2
  • Post #370
  • Quote
  • Nov 12, 2021 4:21am Nov 12, 2021 4:21am
  •  Bionics
  • Joined Dec 2017 | Status: //houston ǝʍ have a probl | 2,239 Posts
Quoting funte
Disliked
{quote} Hey Michael and hello to the others :-) yes, I watched them twice and I'm still learning and trying to figure it out while trading :-D. Today I took that trade successfully: {image} My explanation: The price was rejected twice from the candle on the left with the turquoise zone. Then the Price broke through, got rejected and dropped from the key candle, where I marked the gray zone. Price entered that gray zone again, I entered with a tight stop and the price was rejected quickly and hit my tp. Open to feedback anytime since I'm still learning...
Ignored

Hello Jan,

First of all, I am pleased that you have already achieved your first successes with the Bionic candle. As you know: every beginning is known to be difficult.

Attached Image (click to enlarge)
Click to Enlarge

Name: Folie1.PNG
Size: 93 KB

Your second, gray resistance zone that you have drawn in (Point A) was not yet completely correct, you would probably have been stopped there. The key candle was exactly at point B, because at point C the price was pushed up more strongly. The line was crossed twice, but the candle at Point B was decisive because the price then went down.

Attached Image (click to enlarge)
Click to Enlarge

Name: Folie2.PNG
Size: 113 KB

First of all, I recommend that you get an overview in an M15 or M5. There the key candle is in zone A.

Attached Image (click to enlarge)
Click to Enlarge

Name: Folie3.PNG
Size: 60 KB

Here we see the whole thing again greatly enlarged. How do you manage to identify the return at point B? First you keep the M5 zone at Point A and switch to the M1.

Attached Image (click to enlarge)
Click to Enlarge

Name: Folie4.PNG
Size: 91 KB

Now you draw in the M1, the identified, reduced key candle and this creates a black zone. When the preis got into this zone, you would have had a good entry. Of course, you can't always know exactly whether the course is turning there, but trading is always about probabilities. With the Bionic candle you can improve these probabilities in your favor. I hope that helps you a bit.

Kind regards Michael
Forget: "That does not work," amateurs build the ark, pros the Titanic!
 
2
  • Post #371
  • Quote
  • Nov 12, 2021 4:22am Nov 12, 2021 4:22am
  •  Bionics
  • Joined Dec 2017 | Status: //houston ǝʍ have a probl | 2,239 Posts
Important message to everyone visiting our thread for the first time.

First of all, we are pleased that you would like to take part in this exciting exchange. So that you get the most important basics, please have a look at my first post in the interest of all members:

https://www.forexfactory.com/thread/...rex-navigation

Thank you and we look forward, to a constructive exchange with you. Greetings Michael
Forget: "That does not work," amateurs build the ark, pros the Titanic!
 
 
  • Post #372
  • Quote
  • Nov 12, 2021 4:27am Nov 12, 2021 4:27am
  •  Bionics
  • Joined Dec 2017 | Status: //houston ǝʍ have a probl | 2,239 Posts
Quoting cinalex
Disliked
Thank you for the knowledge. I really need to increase the size of my monitors,
Ignored
Hello cinalex ,I am glad that the information helps you. The subject of monitors is indeed a very important point that every trader should think about. A larger screen area saves a lot of time because some charts don't have to be switched or called up all the time. As a result, you can recognize many more things in a shorter time that are often decisive for trading. In addition, TV sets that provide sufficient reaction times for trading are often significantly cheaper. In the HDMI range with 75Hz and 5ms response time, 1sqm screen area as a monitor costs around € 750. A TV with 4K, 60Hz and 7ms response time, on the other hand, costs only € 450 per square meter. But, the TV has a significantly better 4k resolution. In addition, with fewer monitors, less load is placed on the graphics card or fewer graphics cards are required. The biggest advantage, however, is that you can see the most important information on a single point on a large screen area. All of my friends who have switched to a larger screen would never switch back to a smaller screen. Since nowadays as a customer one have a four-week right of withdrawal from the sales contract, you can even try out risk-free whether you can cope with a larger screen area. I wish you a successful trading day. Greetings Michael
Forget: "That does not work," amateurs build the ark, pros the Titanic!
 
1
  • Post #373
  • Quote
  • Nov 12, 2021 5:33am Nov 12, 2021 5:33am
  •  Bionics
  • Joined Dec 2017 | Status: //houston ǝʍ have a probl | 2,239 Posts
Attached Image

Effective use of time


Hello dear Bionic Traders,

Every participant who takes part in this thread has of course only a limited amount of time, because of his main job, trading, his family and other obligations. It can happen that you miss important articles or information. For this reason, I have summarized all the important information on the first page, which is of course regularly updated. In order not to miss anything, take a look at the first page from time to time, there you will definitely find many things that will help you in your daily activities. Nevertheless, I would also pay attention to the contributions in the thread, as I give individual tips and information there to the individual participants.

I wish you continued success.

Best regards Michael
Forget: "That does not work," amateurs build the ark, pros the Titanic!
 
1
  • Post #374
  • Quote
  • Nov 12, 2021 5:44am Nov 12, 2021 5:44am
  •  watsone
  • | Joined Nov 2004 | Status: Member | 62 Posts
You must be pretty deft on a keyboard Michael,it would take me hours to tap out what you appear to be doing in minutes
 
1
  • Post #375
  • Quote
  • Nov 12, 2021 6:51am Nov 12, 2021 6:51am
  •  Bionics
  • Joined Dec 2017 | Status: //houston ǝʍ have a probl | 2,239 Posts
Quoting watsone
Disliked
You must be pretty deft on a keyboard Michael,it would take me hours to tap out what you appear to be doing in minutes
Ignored
Hello watsone, it looks like this, I can type on the keyboard quite quickly, but I make it a lot easier for myself. I use my iPhone to dictate the text, it's much faster than one can write. Otherwise I wouldn't be able to do it in such a short time. It's similar with my videos, it took me 20 hours for my first video on YouTube, now it is dictated, produced and edited in 3 hours. Of course, it can be done faster, but the quality shouldn't suffer as a result. Greetings Michael
Forget: "That does not work," amateurs build the ark, pros the Titanic!
 
1
  • Post #376
  • Quote
  • Edited 7:37am Nov 12, 2021 7:14am | Edited 7:37am
  •  Bionics
  • Joined Dec 2017 | Status: //houston ǝʍ have a probl | 2,239 Posts
Hello dear Bionic Traders,

Attached Image (click to enlarge)
Click to Enlarge

Name: Folie1.PNG
Size: 111 KB

I posted this chart on November 5th at 4:30 p.m., and assumed that the price would run into my drawn zone.

Attached Image (click to enlarge)
Click to Enlarge

Name: Folie2.PNG
Size: 104 KB

The current status currently looks like this. This zone has been reached, but the big players are still buying the dollar. This suggests that the price will continue to decline.

Attached Image (click to enlarge)
Click to Enlarge

Name: Folie3.PNG
Size: 97 KB

However, there is a small problem with this, because we still have a few Short traders in the market and I am not entirely sure whether they will still be taken out. Thus, the price could be pushed into zone A or even zone B again before it goes further down. We will see.

Attached Image (click to enlarge)
Click to Enlarge

Name: Präsentation1.png
Size: 91 KB


Here are the possible relevant zones in the M15.

Good luck in trading today

Kind regards Michael
Forget: "That does not work," amateurs build the ark, pros the Titanic!
 
1
  • Post #377
  • Quote
  • Nov 12, 2021 2:03pm Nov 12, 2021 2:03pm
  •  Bionics
  • Joined Dec 2017 | Status: //houston ǝʍ have a probl | 2,239 Posts
Hello dear Bionic Traders,

Attached Image (click to enlarge)
Click to Enlarge

Name: Folie1.PNG
Size: 105 KB

Finally, a short update. At 1:27 p.m. today at noon I posted the following resistance zones M15.

Attached Image (click to enlarge)
Click to Enlarge

Name: Folie2.PNG
Size: 114 KB

First there was a fake breakout downwards (Point A) and then the shortraders were taken out (Point B). The price ran exactly into my previously defined resistance zone and back again. The rate is currently in an equilibrium and the dollar is still being collected. I'm curious whether more short traders will be pulled out of the market or whether the price will move further down on Monday.

I wish you all a nice weekend greetings Michael
Forget: "That does not work," amateurs build the ark, pros the Titanic!
 
1
  • Post #378
  • Quote
  • Nov 12, 2021 2:24pm Nov 12, 2021 2:24pm
  •  mtako
  • Joined Sep 2020 | Status: Member | 6,587 Posts
Quoting Bionics
Disliked
{image} Effective use of time Hello dear Bionic Traders, Every participant who takes part in this thread has of course only a limited amount of time, because of his main job, trading, his family and other obligations. It can happen that you miss important articles or information. For this reason, I have summarized all the important information on the first page, which is of course regularly updated. In order not to miss anything, take a look at the first page from time to time, there you will definitely find many things that will help you in your...
Ignored

I have followed your main thread religiously for awhile. It is so nice to see you here !

I will try my best to contribute. I already scalp the 1min, like you. Will look at how the bionic candles work as I trade. Who knows, maybe I will observe something useful to this thread's objectives.

Cheers mate and thanks a million for your dedication !
If I don't mention SL and/or TP = longer-term setup possibly in the works!
 
1
  • Post #379
  • Quote
  • Nov 12, 2021 3:51pm Nov 12, 2021 3:51pm
  •  Bionics
  • Joined Dec 2017 | Status: //houston ǝʍ have a probl | 2,239 Posts
Quoting mtako
Disliked
{quote} I have followed your main thread religiously for awhile. It is so nice to see you here ! I will try my best to contribute. I already scalp the 1min, like you. Will look at how the bionic candles work as I trade. Who knows, maybe I will observe something useful to this thread's objectives. Cheers mate and thanks a million for your dedication !
Ignored
Hello mtako, thank you very much, I'm also happy that you found this thread and that you are participating here. Please read my article on the first page, you will find all the current information. Good luck and I keep my fingers crossed for you. Greetings Michael
Forget: "That does not work," amateurs build the ark, pros the Titanic!
 
1
  • Post #380
  • Quote
  • Nov 12, 2021 3:51pm Nov 12, 2021 3:51pm
  •  Bionics
  • Joined Dec 2017 | Status: //houston ǝʍ have a probl | 2,239 Posts
Important message to everyone visiting our thread for the first time.

First of all, we are pleased that you would like to take part in this exciting exchange. So that you get the most important basics, please have a look at my first post in the interest of all members:

https://www.forexfactory.com/thread/...rex-navigation

Thank you and we look forward, to a constructive exchange with you. Greetings Michael
Forget: "That does not work," amateurs build the ark, pros the Titanic!
 
 
  • Trading Systems
  • /
  • Bionic Chart - The easiest forex navigation
  • Reply to Thread
    • 1 1718Page 192021 47
    • 1 18Page 1920 47
0 traders viewing now
  • More
Top of Page
  • Facebook
  • Twitter
About FF
  • Mission
  • Products
  • User Guide
  • Media Kit
  • Blog
  • Contact
FF Products
  • Forums
  • Trades
  • Calendar
  • News
  • Market
  • Brokers
  • Trade Explorer
FF Website
  • Homepage
  • Search
  • Members
  • Report a Bug
Follow FF
  • Facebook
  • Twitter

FF Sister Sites:

  • Metals Mine
  • Energy EXCH
  • Crypto Craft

Forex Factory® is a brand of Fair Economy, Inc.

Terms of Service / ©2023