It's been a couple of years since I was here but I've coded an indicator and thought I would post it on FF for those who want to dig a little deeper into broker spreads and swaps.
The indicator isn't 'all singing, all dancing' that gives stats on all brokers across all timeframes but if you have the broker accounts already - live preferably but demo also - it will give you a reasonable idea of what's going on behind the scenes with those brokers that you have - or intend to have. You don't just have to rely on what they say or quote on their websites. I know FF has a table of spreads and commissions but this goes further. Maybe there is something else like it out there but I've got no time to see if I'm just "reinventing the wheel".
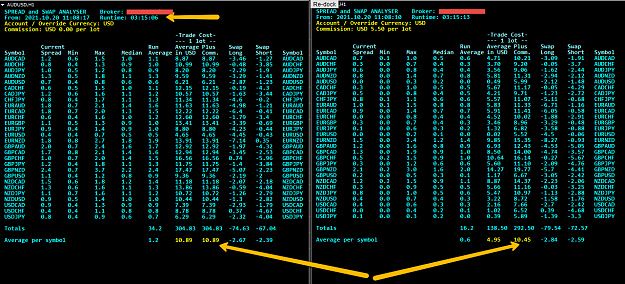
From the top image below you can see two windows - one for broker A and one for broker B. I won't say who they are but suffice it to say they are both well known international FX brokers with fairly good spreads. The one on the left is displaying data on a zero commission account, the one on the right one with a $5.5 commission account (per lot traded). $5-$7 is fairly typical for a round turn unless you've negotiated better rates.
The indicator was started on both accounts within a few seconds of each other and had been running for 3+ hours. I had just selected 28 of the major and minor pairs although the indicator is able to display any symbols you like.
The one on the left shows an average cost per 1 lot traded of $10.89 vs $10.45 on the right. Only about 4 percent difference - on this particular day, time and run duration. So although the one on the left has spreads that are twice as big it equates to a similar cost once the commission is included. If you've managed to negotiate better commissions then the broker on the right may be the better bet - the numbers will come down. However, one also has to consider what else the broker might offer such as the longevity or size of the firm, support, access to funds, funds transfer etc. One other important thing is it also depends on whether you are a scalper or longer term trader. For a scalper costs are critical as the potential profit on a trade is small compared to a longer term trade where costs become less important. However, swaps may then play a part - see below.
The indicator takes a snapshot of the spread for each symbol every second as a default which is ample for this purpose. After you have run the indicator for a few minutes, the totals and averages will settle down. You may find that at certain time of day - not just around news - that the spread for a symbol on one broker may become better than the spread for the same symbol on the other broker - and then flip back again later. I've seen this multiple times with the two brokers I was testing. Minimum and maximum spreads are also displayed so you can see what happens around news, the daily/London/New York open etc.
The swaps columns aren't anything fancy and only give you the raw swap values from Metatrader rather than calculations from the day, price, time, size etc. which would makes the calculations far more complex. However, at least you can see at a glance which has better swaps (positive if you are lucky). The broker on the left has three positive swaps, the one on the right has only one but the one on the right has slightly better averages. In in reality though neither are good.
One other factor that would be worth having is order slippage / re-quote data over time for both limits and market orders. Slippage on limits can be tested for in an indicator/EA but for market orders the data collection would have to be integrated into an order manager and tested over a period of time. Much more difficult. Unless someone knows of an EA/product that can do it easier? Years ago there was a bunch of trader tools that you could subscribe to that did a lot of background checking on this sort of stuff including account drops, price feed anomalies etc. but the company stopped trading. Hmmm... I wonder why...
There a couple of mods I might make make to the indi at a later stage. I may include a stop/start button and also a button that outputs a snapshot of the data to a file. Maybe also based on a timer. This file could be then be imported into Excel for comparison with other times, brokers etc. I'm sure the brokers themselves have something similar but way more sophisticated to analyse every other broker under the sun. This indi is simple stuff in comparison but gives us a little edge in any decision making. You could even quote the stats to any brokers you are dealing with!
NOTE 1:
1) When entering the commission value into the indicator you don't have to use the commission based in your own account CCY. You can override the CCY with ay CCY you want - GBP, EUR, USD, AUD etc.
2) Make sure ALL symbols are selected in Market Watch unless you are only interested in looking at the pairs you currently trade.
3) Some of you may find the columns overlapping (weird Windows font stuff). In this case change the font or the X and Y gaps in the indicator.
4) If you find a particular symbol e.g. BTCUSD has either zeros or some crazy number in the spread columns then adjust the spread multiplier next to the symbol. This can be any 10s number e.g. 0.0001,10000 etc. Some broker quote their point size on some symbols differently. Make sure to include the ";" between symbol and multiplier.
5) If rows fail to display on initial MT4 start up then re-apply the indicator. This may have something to do with initial function getting stuck on a symbol.
NOTE 2:
If you have any screenshots of your broker's spreads/swaps then I will leave it up to you whether you post them but I would say that everyone will have to take what is posted with a pinch of salt. Results can easily be falsified in a positive or negative way depending on which side of the fence you are on. DISCLAIMER: USE IT AT YOU OWN RISK
I will probably convert this indi for use in MT5 soon. I will not reply to comments quickly - sorry - (especially bad ones lol) as I have many other things on the go. If any abuse starts then I'll just close the thread and then just send any new updates to my trader mates. Simple.
Hope you get something out of it.
The indicator isn't 'all singing, all dancing' that gives stats on all brokers across all timeframes but if you have the broker accounts already - live preferably but demo also - it will give you a reasonable idea of what's going on behind the scenes with those brokers that you have - or intend to have. You don't just have to rely on what they say or quote on their websites. I know FF has a table of spreads and commissions but this goes further. Maybe there is something else like it out there but I've got no time to see if I'm just "reinventing the wheel".
From the top image below you can see two windows - one for broker A and one for broker B. I won't say who they are but suffice it to say they are both well known international FX brokers with fairly good spreads. The one on the left is displaying data on a zero commission account, the one on the right one with a $5.5 commission account (per lot traded). $5-$7 is fairly typical for a round turn unless you've negotiated better rates.
The indicator was started on both accounts within a few seconds of each other and had been running for 3+ hours. I had just selected 28 of the major and minor pairs although the indicator is able to display any symbols you like.
The one on the left shows an average cost per 1 lot traded of $10.89 vs $10.45 on the right. Only about 4 percent difference - on this particular day, time and run duration. So although the one on the left has spreads that are twice as big it equates to a similar cost once the commission is included. If you've managed to negotiate better commissions then the broker on the right may be the better bet - the numbers will come down. However, one also has to consider what else the broker might offer such as the longevity or size of the firm, support, access to funds, funds transfer etc. One other important thing is it also depends on whether you are a scalper or longer term trader. For a scalper costs are critical as the potential profit on a trade is small compared to a longer term trade where costs become less important. However, swaps may then play a part - see below.
The indicator takes a snapshot of the spread for each symbol every second as a default which is ample for this purpose. After you have run the indicator for a few minutes, the totals and averages will settle down. You may find that at certain time of day - not just around news - that the spread for a symbol on one broker may become better than the spread for the same symbol on the other broker - and then flip back again later. I've seen this multiple times with the two brokers I was testing. Minimum and maximum spreads are also displayed so you can see what happens around news, the daily/London/New York open etc.
The swaps columns aren't anything fancy and only give you the raw swap values from Metatrader rather than calculations from the day, price, time, size etc. which would makes the calculations far more complex. However, at least you can see at a glance which has better swaps (positive if you are lucky). The broker on the left has three positive swaps, the one on the right has only one but the one on the right has slightly better averages. In in reality though neither are good.
One other factor that would be worth having is order slippage / re-quote data over time for both limits and market orders. Slippage on limits can be tested for in an indicator/EA but for market orders the data collection would have to be integrated into an order manager and tested over a period of time. Much more difficult. Unless someone knows of an EA/product that can do it easier? Years ago there was a bunch of trader tools that you could subscribe to that did a lot of background checking on this sort of stuff including account drops, price feed anomalies etc. but the company stopped trading. Hmmm... I wonder why...
There a couple of mods I might make make to the indi at a later stage. I may include a stop/start button and also a button that outputs a snapshot of the data to a file. Maybe also based on a timer. This file could be then be imported into Excel for comparison with other times, brokers etc. I'm sure the brokers themselves have something similar but way more sophisticated to analyse every other broker under the sun. This indi is simple stuff in comparison but gives us a little edge in any decision making. You could even quote the stats to any brokers you are dealing with!
NOTE 1:
1) When entering the commission value into the indicator you don't have to use the commission based in your own account CCY. You can override the CCY with ay CCY you want - GBP, EUR, USD, AUD etc.
2) Make sure ALL symbols are selected in Market Watch unless you are only interested in looking at the pairs you currently trade.
3) Some of you may find the columns overlapping (weird Windows font stuff). In this case change the font or the X and Y gaps in the indicator.
4) If you find a particular symbol e.g. BTCUSD has either zeros or some crazy number in the spread columns then adjust the spread multiplier next to the symbol. This can be any 10s number e.g. 0.0001,10000 etc. Some broker quote their point size on some symbols differently. Make sure to include the ";" between symbol and multiplier.
5) If rows fail to display on initial MT4 start up then re-apply the indicator. This may have something to do with initial function getting stuck on a symbol.
NOTE 2:
If you have any screenshots of your broker's spreads/swaps then I will leave it up to you whether you post them but I would say that everyone will have to take what is posted with a pinch of salt. Results can easily be falsified in a positive or negative way depending on which side of the fence you are on. DISCLAIMER: USE IT AT YOU OWN RISK
I will probably convert this indi for use in MT5 soon. I will not reply to comments quickly - sorry - (especially bad ones lol) as I have many other things on the go. If any abuse starts then I'll just close the thread and then just send any new updates to my trader mates. Simple.
Hope you get something out of it.
Attached Image (click to enlarge)
Attached Image (click to enlarge)
Attached File(s)