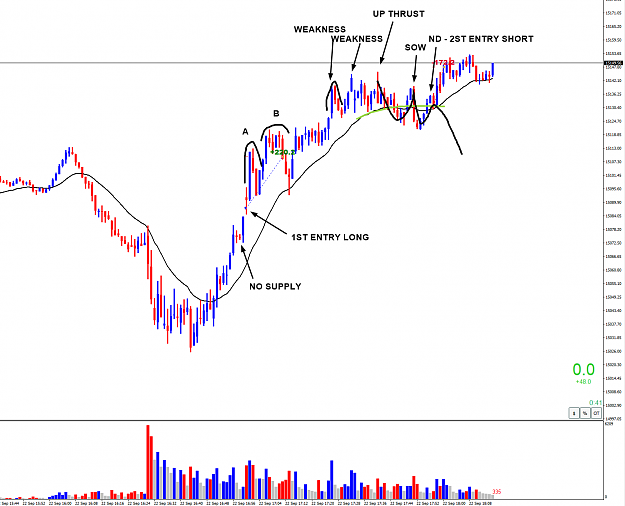
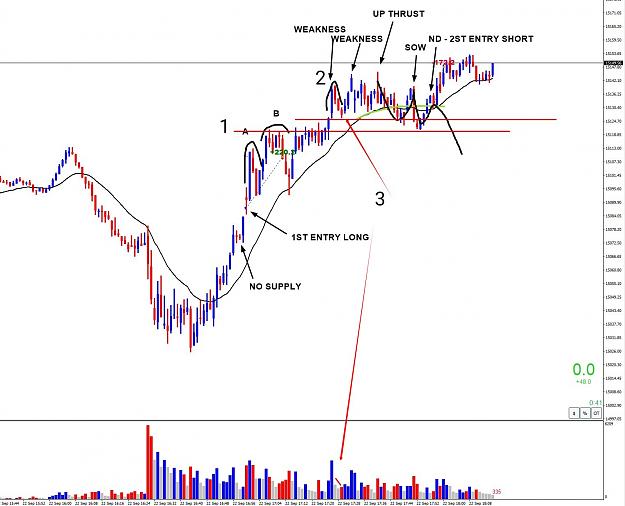
Disliked{quote} The bar marked as no demand... it has average range, closing off the high, with volume <2. Doesnt this mean that there is certainly demand in this bar, and that the low volume would show a lack of selling, hence the reason it was able to travel so far up on low volume?Ignored
Attached Image (click to enlarge)
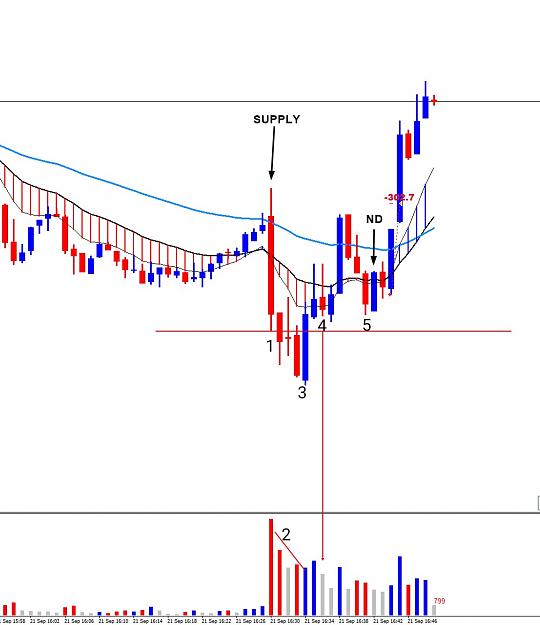
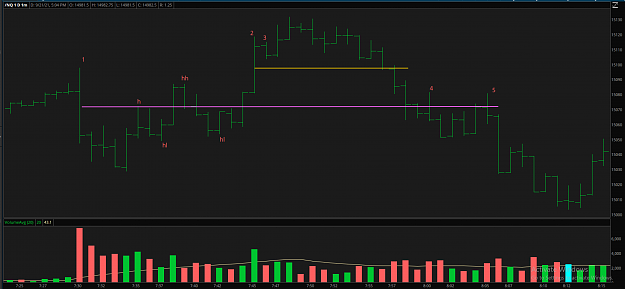
Right I'm glad you replied with curiousity, tbh it was a poor explaination, so I've gone back to an app I prefer for analysis.
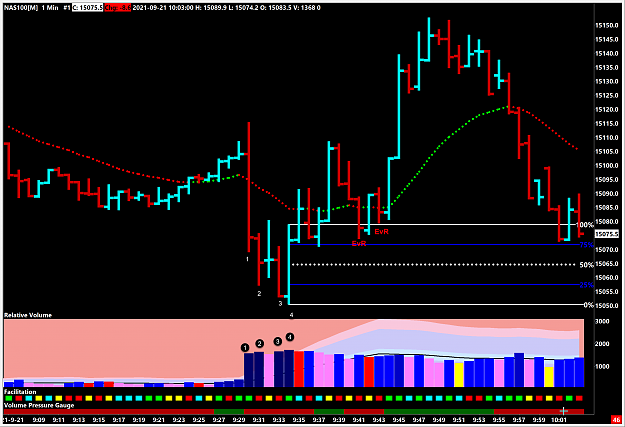
1. widespread bar closing off the bottom v high volume, the closure indicates there must have been some buying on this bar as it is off the lows.
I would draw my line on the low of the bar not the close, that's just me
2. as the price tries to go down volume drops off the big boys have lost interest in the price going any further down (could this confirm buying on the previous wide spread down bar
3. is a 2 bar reversal this for me would be confirmation, so ignore any no demands as the would be palm trees in the artic
4. 2 bars after the reversal no supply, look at the volume of that bar in relation to the wide spread bar there is no interest, I would have bought on this (but I tell you why I won't at the end)
5. they give you another entry point which I don't believe happens very often, again the spread of the down bar, and look at the volume in relation to bar number 4, and the spreads even wider (volume anomalies spring to mind)
I wouldn't take this trade as it's on a 1 minute chart, you get too many false signals, even though that was pretty clear
I hope this is better explained
6