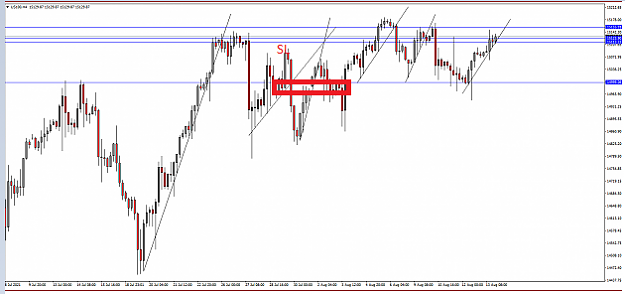
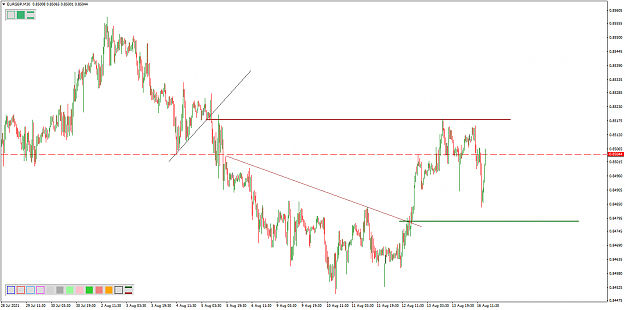
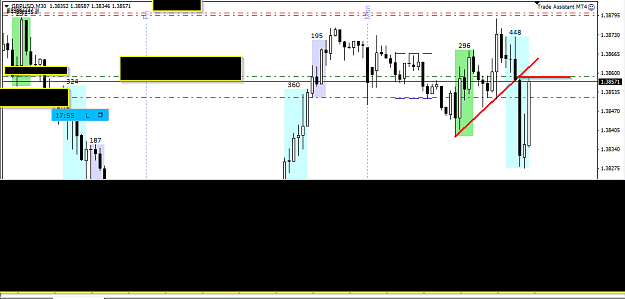
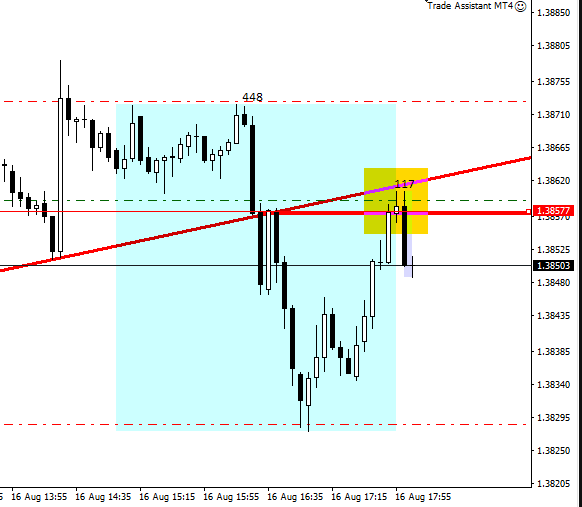
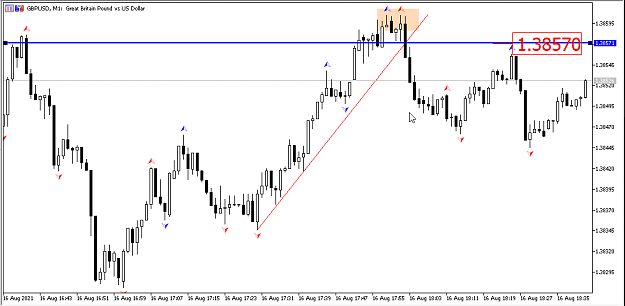
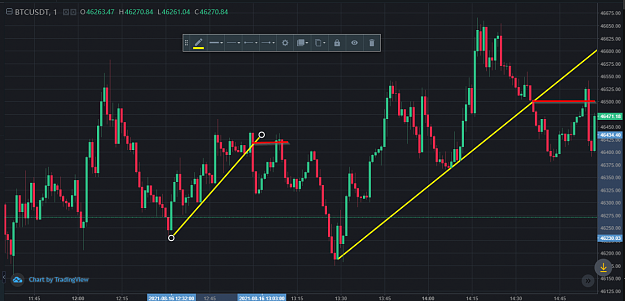
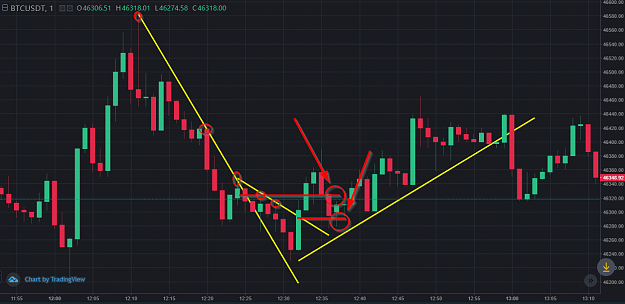
• Home
  • Forums
  • Trades
  • News
  • Calendar
  • Market
  • Brokers
  • Login
  • Join
  • User/Email: Password:
  • 8:26am
Menu
  • Forums
  • Trades
  • News
  • Calendar
  • Market
  • Brokers
  • Login
  • Join
  • 8:26am
Sister Sites
  • Metals Mine
  • Energy EXCH
  • Crypto Craft

Options

Bookmark Thread

First Page First Unread Last Page Last Post

Print Thread

Similar Threads

Question about OrderFlow or OrderPosting via Broker or LiqProv 1 reply

Collection of posts/threads from orderflow traders 0 replies

Trendline, Trendline and Trendline 4 replies

Using future orderflow, to predict spot prices 16 replies

Vidas - Orderflow 1 reply

  • Trading Systems
  • /
  • Reply to Thread
  • Subscribe
  • 528
Attachments: Simple Trendline Orderflow System
Exit Attachments

Simple Trendline Orderflow System

  • Last Post
  •  
  • 1 Page 23456 31
  • 1 Page 234 31
  •  
  • Post #21
  • Quote
  • Aug 15, 2021 3:49am Aug 15, 2021 3:49am
  •  scherzi
  • Joined Aug 2013 | Status: Member | 591 Posts
Quoting EngineerFx
Disliked
{quote} Thank you for the comment. I think it is proper to mention that this approach is not the typical trendline-break-and-retest strategy which is pretty common. In this method, we are looking for areas of demand or supply that are most important - clear areas where orders reside and we often would find those at trendline break levels. Hence it is important to note that price needs to break key levels to the downside (for sell setups) or to the upside (for buy setups). So your comments fits correctly with this approach - need for price to break...
Ignored
Yes, a heuristic approach to determine a market break is to spot a second swing break, that is why I mentioned it
 
1
  • Post #22
  • Quote
  • Aug 15, 2021 7:54am Aug 15, 2021 7:54am
  •  josi
  • Joined Aug 2019 | Status: Member | 438 Posts | Invisible
Quoting EngineerFx
Disliked
{quote} Nice one. Eyeing that level on GJ for a sell next week {image}
Ignored
excellent
I like your thread
But give me a hand here - what happens if we take regular examples and avoid possible cherry-picking.
Analyse that (as for film-titles), please...
Attached Image (click to enlarge)
Click to Enlarge

Name: US100H4.png
Size: 55 KB
 
 
  • Post #23
  • Quote
  • Aug 15, 2021 10:11am Aug 15, 2021 10:11am
  •  EngineerFx
  • Joined Jan 2020 | Status: Member | 146 Posts
Quoting josi
Disliked
{quote} excellent I like your thread But give me a hand here - what happens if we take regular examples and avoid possible cherry-picking. Analyse that (as for film-titles), please... {image}
Ignored
No one is cherry-picking here.

First you didn't draw most of the TLs correctly and as a consequence your levels were not correct as per method.

Also when price has visited a level we typically should not trade that level on the second visit. And we want to see price coming from weak levels.

Thirdly, if in doubt look for LTF TL breaks at higher TF TL break levels for confirmation and to get higher RR.

Fourthly, the US100 is a strongly bullish market. For best results trade in trend direction.

And finally, backtest this method extensively and if in doubt, don't adopt it.
Attached Image (click to enlarge)
Click to Enlarge

Name: US100H4.png
Size: 32 KB
Trading should not be difficult
 
7
  • Post #24
  • Quote
  • Aug 15, 2021 1:19pm Aug 15, 2021 1:19pm
  •  E7i
  • | Joined Feb 2017 | Status: Member | 70 Posts | Online Now
Ah, so the Supply and Demand strategy (or a part of it anyway)
Subscribed, I've been using this on Cryptos but wish to learn more from this thread none the less. Hope you post for a while More for me to learn.
 
 
  • Post #25
  • Quote
  • Aug 15, 2021 1:31pm Aug 15, 2021 1:31pm
  •  anubieonly
  • Joined Mar 2021 | Status: Hate non sense talk, eat ur own BS | 625 Posts
Quoting josi
Disliked
{quote} excellent I like your thread But give me a hand here - what happens if we take regular examples and avoid possible cherry-picking. Analyse that (as for film-titles), please... {image}
Ignored
Hi mate, I share my experience using this simple way, so this simple method for me like to find the good sr in snd zones, I usually use D1 and H4 then find an entry on M30 with looking closely candle could be pinbar, engulf, or candl patterns like piercing, mother child inside, outside ... there are many ways to add certainty levels like add on H4 the zigzag or fractal to make sure peak or bottom prev swing no more continuation, to be honest I use other method too like fibo ret and form of harmonic pattern rhythm as history always repeat, but I realized no need the complicated method since this simple way is already enough and can give the same result

Based on my exp usually this way always got huge RR as EngineerFX said but need patience. Last week many trades NJ NCHF, AJ, CHFJ most of it closed more than 50-90 pips. On my current trades GJ n GCHF on above charts I got more than 100 pips but not close yet so can be less, but see the risk reward is very good. So even sometimes you got false confirmation on LTF then the SL hit should be small a bit above or below sr horizontal lines or at the last peak / bottom of prev swings.
And on your chart I think better no entry on retest red box as SL not good
Attached Image (click to enlarge)
Click to Enlarge

Name: 090f1f8de564693503dd2c83056ee177.png
Size: 94 KB
Hope everyone gets green pips
 
1
  • Post #26
  • Quote
  • Aug 15, 2021 1:57pm Aug 15, 2021 1:57pm
  •  EngineerFx
  • Joined Jan 2020 | Status: Member | 146 Posts
Quoting anubieonly
Disliked
{quote} Hi mate, I share my experience using this simple way, so this simple method for me like to find the good sr in snd zones, I usually use D1 and H4 then find an entry on M30 with looking closely candle could be pinbar, engulf, or candl patterns like piercing, mother child inside, outside ... there are many ways to add certainty levels like add on H4 the zigzag or fractal to make sure peak or bottom prev swing no more continuation, to be honest I use other method too like fibo ret and form of harmonic pattern rhythm as history always repeat,...
Ignored
Even on that setup level marked by your red box the trade there is good. Usually we don't want huge SL so when the swing that broke the TL is that huge, we may want to zoom in and identify internal levels. As is clear on my chart (here I have zoomed into the area on M15), we can see that we can take the first trade there at the lower level with a small SL. TP1 will be as marked on the chart, because that area is another TL breakout area (or if you are willing to take the risk you may buy there as well especially because of the impulsive move). Then we see an internal level around 15070 that worked pretty well and we saw price go all the way down from there.
Attached Image (click to enlarge)
Click to Enlarge

Name: ABC.png
Size: 172 KB
Trading should not be difficult
 
4
  • Post #27
  • Quote
  • Aug 15, 2021 2:09pm Aug 15, 2021 2:09pm
  •  anubieonly
  • Joined Mar 2021 | Status: Hate non sense talk, eat ur own BS | 625 Posts
Quoting EngineerFx
Disliked
{quote} Even on that setup level marked by your red box the trade there is good. Usually we don't want huge SL so when the swing that broke the TL is that huge, we may want to zoom in and identify internal levels. As is clear on my chart (here I have zoomed into the area on M15), we can see that we can take the first trade there at the lower level with a small SL. TP1 will be as marked on the chart, because that area is another TL breakout area (or if you are willing to take the risk you may buy there as well especially because of the impulsive...
Ignored
yes mate, by zoom in to LTF we still able to get small risk
Hope everyone gets green pips
 
 
  • Post #28
  • Quote
  • Aug 16, 2021 5:17am Aug 16, 2021 5:17am
  •  puma
  • | Joined Mar 2009 | Status: Member | 78 Posts
Do you suggest any pair better than others? On indexes might work as well? Thanks a lot!
 
 
  • Post #29
  • Quote
  • Aug 16, 2021 5:39am Aug 16, 2021 5:39am
  •  scherzi
  • Joined Aug 2013 | Status: Member | 591 Posts
Quoting puma
Disliked
Do you suggest any pair better than others? On indexes might work as well? Thanks a lot!
Ignored
I haven't studied this setup. In any case , each asset has its own personality, and as per my experience, it is better to focus on a sole security till you get used to it.

NQ or S&P500 follow the same pricing patterns as FX, but at different hours and with different configuration than fx majors. Equity indices should offer good candidates. I do not trade volatility indices, and I do not think they should be traded in this manner, since volatility is more related to the option strike premium prices.

But the retest of anchor points occurs the same on equity indices.

You only need to take a major index and test it yourself.
 
 
  • Post #30
  • Quote
  • Aug 16, 2021 8:25am Aug 16, 2021 8:25am
  •  Patso
  • | Joined Dec 2009 | Status: Member | 173 Posts
Quoting EngineerFx
Disliked
I want to introduce a very simple but highly rewarding strategy. This strategy requires patience, but it comes with good risk -reward. The basis of this strategy is the use of the Trendline tool and horizontal line. Rules : 1. Identify a clear trendline break. Let price do its thing and break the trendline to the downside/upside depending on direction. 2. Draw a horizontal line to mark the price point at which the trendline was broken. 3. Watch as price returns to this price point. 4. Sell/Buy when price returns to the price level or wait for break...
Ignored
Just discovered this thread. I trade in a similar fashion, so, I will fit right in. I have a couple of indicators(MT4) that "auto draw" trendlines on all timeframes. They are very useful and work quite effectively(IMHO). I've attached them here, if anyone wants them. Thank you for sharing your trading system, much appreciated.
Attached Files
File Type: ex4 Demark_trend_alert_and_mail.ex4   51 KB | 387 downloads
File Type: mq4 Demark_trend_alert_and_mail.mq4   16 KB | 463 downloads
File Type: ex4 Tangent2-S.ex4   24 KB | 383 downloads
File Type: mq4 Tangent2-S.mq4   14 KB | 480 downloads
 
8
  • Post #31
  • Quote
  • Aug 16, 2021 9:01am Aug 16, 2021 9:01am
  •  Patso
  • | Joined Dec 2009 | Status: Member | 173 Posts
Quoting EngineerFx
Disliked
I want to introduce a very simple but highly rewarding strategy. This strategy requires patience, but it comes with good risk -reward. The basis of this strategy is the use of the Trendline tool and horizontal line. Rules : 1. Identify a clear trendline break. Let price do its thing and break the trendline to the downside/upside depending on direction. 2. Draw a horizontal line to mark the price point at which the trendline was broken. 3. Watch as price returns to this price point. 4. Sell/Buy when price returns to the price level or wait for break...
Ignored
This may be helpful to the group as well. An excellent video on simple PA Trading with the trend, with optimal entries on trend line breaks. https://www.youtube.com/watch?v=T-HkyhZCLOw&t=2187s
 
1
  • Post #32
  • Quote
  • Aug 16, 2021 9:36am Aug 16, 2021 9:36am
  •  EngineerFx
  • Joined Jan 2020 | Status: Member | 146 Posts
Quoting EngineerFx
Disliked
Eurgbp today based on method On M30 we returned to previous level but didn't pull the trigger immediately upon return because it was the second time visit. But given that level, I looked for a setup on M1 for an entry. {image} {image}
Ignored
Closed my trade last Friday for the week, but it's pretty clear what happened to price
Attached Image (click to enlarge)
Click to Enlarge

Name: EURGBPM30.png
Size: 48 KB
Trading should not be difficult
 
3
  • Post #33
  • Quote
  • Edited at 10:08am Aug 16, 2021 9:51am | Edited at 10:08am
  •  EngineerFx
  • Joined Jan 2020 | Status: Member | 146 Posts
Quoting EngineerFx
Disliked
{quote} Closed my trade last Friday for the week, but it's pretty clear what happened to price {image}
Ignored
The logic for this strategy is simple: In a compressed area one of two things are possibly happening: institutional buying or institutional selling. So when price breaks out explosively from a compressed zone (accumulation or distribution zone) we can expect at least a bounce when price returns to that zone.
But why can't we just buy from a demand/supply zone?
The answer is that we could actually do that. But there are multiple supply and demand zones on the chart. We want to only concentrate on those associated with compressed zones. That helps with patience (which is a requirement for trading anyway) and accuracy as well.
Trading should not be difficult
 
5
  • Post #34
  • Quote
  • Edited at 11:42am Aug 16, 2021 10:57am | Edited at 11:42am
  •  scherzi
  • Joined Aug 2013 | Status: Member | 591 Posts
Look, please be aware that now IT IS VERY LATE for trading GU.

Attached Image (click to enlarge)
Click to Enlarge

Name: 7dce727e15dec1405a056b57f46f6474.png
Size: 44 KB


Lol, very funny the reaction almost immediately (zoomed in to M5).
Attached Image


See on m1 the current PA.
Attached Image (click to enlarge)
Click to Enlarge

Name: f5fc4f1a96fb2d18c450d9944b861084.png
Size: 46 KB
 
2
  • Post #35
  • Quote
  • Aug 16, 2021 12:21pm Aug 16, 2021 12:21pm
  •  EngineerFx
  • Joined Jan 2020 | Status: Member | 146 Posts
Quoting scherzi
Disliked
Look, please be aware that now IT IS VERY LATE for trading GU. {image} Lol, very funny the reaction almost immediately (zoomed in to M5). {image} See on m1 the current PA.{image}
Ignored
Perfect Scherzi. Exact level I was watching
Trading should not be difficult
 
 
  • Post #36
  • Quote
  • Aug 16, 2021 2:27pm Aug 16, 2021 2:27pm
  •  Piphunter40
  • | Joined Jan 2021 | Status: Member | 34 Posts
I see you have variety of time frames in here? How do you start looking. Is there a preferred time frame you start with and then move up or down depending on how many trades you find?
 
 
  • Post #37
  • Quote
  • Aug 16, 2021 3:22pm Aug 16, 2021 3:22pm
  •  scherzi
  • Joined Aug 2013 | Status: Member | 591 Posts
Quoting Piphunter40
Disliked
I see you have variety of time frames in here? How do you start looking. Is there a preferred time frame you start with and then move up or down depending on how many trades you find?
Ignored
That depends on how you define your setups.

I usually take a higher timeframe and try to trade lower timeframes respecting that higher timeframe structures.

But this is really complex and unless your strategy includes multi timeframe analysis, you do not need it.

Secondly, the timeframe is very generic.

At what time does your timeframe starts, for instance, for the daily bars? At 0:00 GMT?, at 0:00 UK time? at 0:00 EST time? at 8:00 Germany time? Why do you consider that specific hour, minute and second the reference hour?

It is not trivial and, unless you have an objective, the timeframe is not important.

I do not like trading below M5 because I feel a lot of pressure because of the comission, but many times I trade M1.

Today I traded M30 for the GU short even if my targets were set using M5.

Different assets react differently to timeframes. Maybe on EU you can see meaningful structures on M1 and you need to move up to M5 or M15 on another asset to frame objectives of the same duration and/or relative range.

Adding timeframe analysis comes after identifying correctly price action.

Instead, it is more interesting learning at which hours the different assets trade. It is easy, you open a chart and study for a month at which hours the price moves were stronger in average. That's it. Or if you do not want volatility, you do the opposite.

I know that after 18:00 UK time GU is not going to do too much in average, that is why I warned about that on my post above about the GU setup, for instance.
 
1
  • Post #38
  • Quote
  • Aug 16, 2021 3:31pm Aug 16, 2021 3:31pm
  •  scherzi
  • Joined Aug 2013 | Status: Member | 591 Posts
Just checking for curiosity, I like scalping crytopcurrencies on the M1 timeframe.

Due to the high volatily of cryptos you do not need leverage, even only spot long trading without shorting, and therefore, with limited risk vs unlimited profit is one thing I love about cryptos.

Attached Image (click to enlarge)
Click to Enlarge

Name: a8e713101b1fb61ddb79a188b1d5d9a2.png
Size: 135 KB


Attached Image (click to enlarge)
Click to Enlarge

Name: 50eab1ecd6818b311da975aa8af2202c.png
Size: 142 KB
 
1
  • Post #39
  • Quote
  • Aug 16, 2021 5:05pm Aug 16, 2021 5:05pm
  •  EngineerFx
  • Joined Jan 2020 | Status: Member | 146 Posts
Quoting scherzi
Disliked
Just checking for curiosity, I like scalping crytopcurrencies on the M1 timeframe. Due to the high volatily of cryptos you do not need leverage, even only spot long trading without shorting, and therefore, with limited risk vs unlimited profit is one thing I love about cryptos. {image} {image}
Ignored
Interesting that you brought that up. What a lovely chart of Ripple.
Attached Image (click to enlarge)
Click to Enlarge

Name: XRP.PNG
Size: 138 KB
Trading should not be difficult
 
2
  • Post #40
  • Quote
  • Aug 16, 2021 5:14pm Aug 16, 2021 5:14pm
  •  EngineerFx
  • Joined Jan 2020 | Status: Member | 146 Posts
Quoting EngineerFx
Disliked
{quote} Interesting that you brought that up. What a lovely chart of Ripple. {image}
Ignored
Even the almighty BTC was not spared
Attached Image (click to enlarge)
Click to Enlarge

Name: BTCUSD.PNG
Size: 150 KB
Trading should not be difficult
 
3
  • Trading Systems
  • /
  • Simple Trendline Orderflow System
  • Reply to Thread
    • 1 Page 23456 31
    • 1 Page 234 31
0 traders viewing now
  • More
Top of Page
Forex Factory Blog Updated: Alerting All Members
  • Facebook
  • Twitter
About FF
  • Mission
  • Products
  • User Guide
  • Media Kit
  • Blog
  • Contact
FF Products
  • Forums
  • Trades
  • Calendar
  • News
  • Market
  • Brokers
  • Trade Explorer
FF Website
  • Homepage
  • Search
  • Members
  • Report a Bug
Follow FF
  • Facebook
  • Twitter

FF Sister Sites:

  • Metals Mine
  • Energy EXCH
  • Crypto Craft

Forex Factory® is a brand of Fair Economy, Inc.

Terms of Service / ©2022