The only impartial feeling is love. It is also the only feeling of God.
- #136,121
- Jul 13, 2021 6:11am Jul 13, 2021 6:11am
- Joined Aug 2019 | Status: Like everyone, Light from Light! | 2,352 Posts
- #136,124
- Jul 13, 2021 6:37am Jul 13, 2021 6:37am
- Joined May 2014 | Status: Full Time Trader | 27,314 Posts
Focus only on what truly matters!
- #136,127
- Jul 13, 2021 6:56am Jul 13, 2021 6:56am
- Joined May 2014 | Status: Full Time Trader | 27,314 Posts
Focus only on what truly matters!
- #136,129
- Jul 13, 2021 7:09am Jul 13, 2021 7:09am
- Joined Sep 2020 | Status: Trader | 8,702 Posts
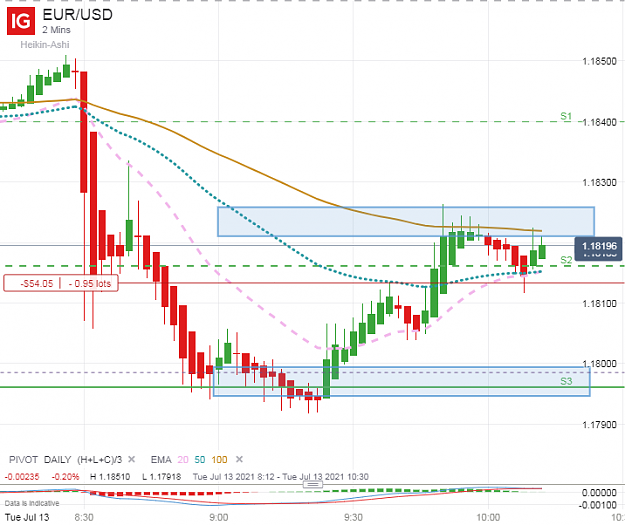
If I don't mention SL and/or TP = longer-term setup possibly in the works!
- #136,130
- Jul 13, 2021 7:10am Jul 13, 2021 7:10am
- Joined May 2014 | Status: Full Time Trader | 27,314 Posts
Focus only on what truly matters!
- #136,131
- Edited 7:46am Jul 13, 2021 7:12am | Edited 7:46am
- Joined Jul 2007 | Status: Trader | 3,577 Posts
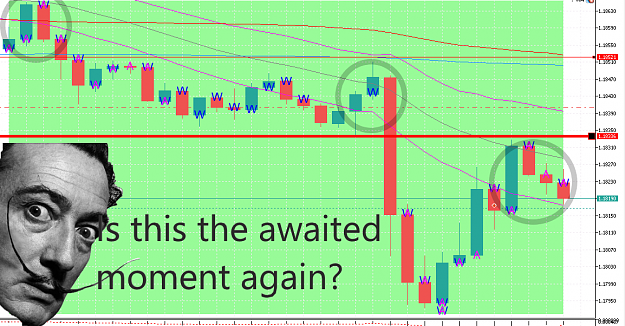
...because you never know - until you do!
- #136,133
- Jul 13, 2021 7:41am Jul 13, 2021 7:41am
- Joined Sep 2020 | Status: Trader | 8,702 Posts

If I don't mention SL and/or TP = longer-term setup possibly in the works!
- #136,135
- Jul 13, 2021 8:05am Jul 13, 2021 8:05am
- Joined May 2014 | Status: Full Time Trader | 27,314 Posts
Focus only on what truly matters!
- #136,136
- Jul 13, 2021 8:17am Jul 13, 2021 8:17am
- Joined Sep 2020 | Status: Trader | 8,702 Posts
If I don't mention SL and/or TP = longer-term setup possibly in the works!
- #136,139
- Jul 13, 2021 9:16am Jul 13, 2021 9:16am
- Joined Jun 2009 | Status: Trader | 1,734 Posts
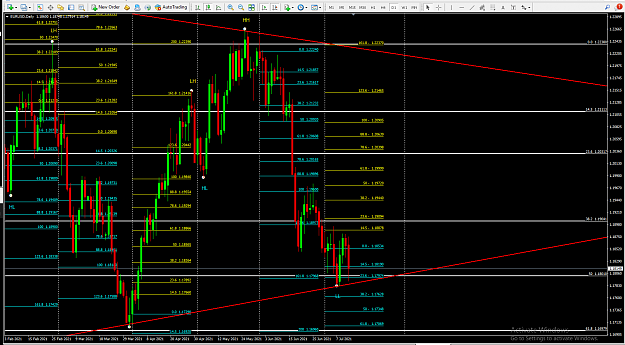
MY GRID. Markets are NOT random.
- #136,140
- Jul 13, 2021 9:32am Jul 13, 2021 9:32am
- Joined Sep 2020 | Status: Trader | 8,702 Posts

If I don't mention SL and/or TP = longer-term setup possibly in the works!