• Home
  • Forums
  • Trades
  • News
  • Calendar
  • Market
  • Brokers
  • Login
  • Join
  • User/Email: Password:
  • 5:15pm
Menu
  • Forums
  • Trades
  • News
  • Calendar
  • Market
  • Brokers
  • Login
  • Join
  • 5:15pm
Sister Sites
  • Metals Mine
  • Energy EXCH
  • Crypto Craft

Options

Bookmark Thread

First Page First Unread Last Page Last Post

Print Thread

Similar Threads

Twitch Journal - Live Journal 4 replies

Hey, im just learning journal..... 13 replies

Another Trading Journal - Yuhu's Journal 16 replies

My Personal journal up 18% in 2 months going to start a journal 8 replies

My GBP/CHF Trading Journal....Just Trade It 6 replies

  • Trading Journals
  • /
  • Reply to Thread
  • Subscribe
  • 46
Attachments: Just A Journal
Exit Attachments
Tags: Just A Journal
Cancel

Just A Journal

  • Last Post
  •  
  • 1 Page 2
  • 1 Page 2
  •  
  • Post #21
  • Quote
  • Oct 19, 2020 4:20am Oct 19, 2020 4:20am
  •  LauraT
  • Joined Apr 2020 | Status: Daylight Roadmapper | 1,304 Posts
Section 15 - Trade The Plan

When I ask traders if they have a trading plan I tend to get two answers. Either they don't, or they do but, upon examination, they have one that isn't fit for purpose. The reasons it isn't fit for purpose will hopefully become clear as this post progresses.

I think there is a general reticence around writing a trading plan. It either feels too difficult or quite pointless. Based upon the majority of plans I see, I can completely understand why those conclusions are reached. What is invariably written is a one-time document that will be printed out to gather dust on a shelf or stored away on a computer to be rarely, if ever, looked at again.

What I hope to set out here is a different way to approach a trading plan. A way that ensures the trader ends up with a living, breathing document that gives up to the moment useful information. A trading plan should never be a 'once and done' affair. It should evolve as the trader evolves and it should document and reflect the journey the trader has taken to date (and where they want to head in the future).

The trading plan outline I'm going to set out has 7 sections. Some sections will be more interactive than others but all 7 will be fluid. They will change as the trader develops. Bear in mind this is purely my opinion around what an effective trading plan should look like. Traders might have their own ideas about what should be included and how it should be structured. The key thing is to end up with a plan that serves the required purposes.

OK - let's dive straight in.

Part 1. Pledge & Principles

This section deals with the fundamental commitment a trader makes to their trading and to their plan. It will likely include a pledge to always seek to trade in accordance with their plan, to keep their plan updated, to carry out a weekly review of their trades and results.

It will also likely include a pledge to stick to the 'golden rules' as defined by the trader. That might be that they will commit to taking the setups when they present themselves, without fear or hesitation. That they will take a loss when the market proves them wrong, again without fear or hesitation.

The list here will likely end up quite long. The trader should seek to capture all those fundamental do's and do not's that will form the backbone of how and why they trade.

Part 2. Traded Setups

Next we come to the section that most people think a trading plan should include. The problem is, they end up writing a plan that only contains this section.

In this part, the trader should capture, in great detail, what will get them into a trade, what will get them out of a trade, what their risk management profile is, what their money management strategy is, what hours/days they will trade, what timeframes they will trade etc etc.

Part 3. Weekly Profit Factor (and Win Rate)

Trading is a results orientated pursuit, of course.

A straightforward way to keep track of progress is to capture each trade taken and the outcome, in order that end of the week analysis can be done. Profit Factor is simply the total monetary winnings divided by the total monetary losses. So, if a trader has winnings of £6000 and losses of £2000 their Profit Factor is 3.0.

It's also helpful to capture the weekly win rate and the total trades taken for future analysis. Having the dedication to record and update this information on a weekly basis will provide invaluable statistics and a clear indication of progress or lack of.

This section hopefully demonstrates what I mean by turning your trading plan into a living document rather than something you write once and forget about.

Part 4. Trading Journal

The most important section of any trading plan, in my opinion.

This is where the trader records details of every trade taken. What got them into the trade, how they felt during the trade and what got them out. The amount of profit or loss (which will, at the end of the week, feed into the Weekly Profit Factor section of the trading plan).

How a trader feels during a trade might seem like a strange thing to record at first. But remember what I've written on trading psychology in the past. Emotions drive behaviours. If we can isolate the emotions that lead us to make poor decisions, we can work on changing and improving.

Part 5. Mentoring Notes/Tasks

If a trader is fortunate enough to have access to a mentor, this is where the outcomes of the sessions should be recorded. It should include a general overview of the discussions and specific goals or tasks as a result of those discussions. The tasks will then be carried forward to Section 6 (Development Pending).

If a trader doesn't have access to a mentor, consider finding one would be my advice. Even if you can't find an experienced consistently profitable trader to fulfill the role, try to find someone whose opinion you respect. Even if they can't provide a full mentoring service, they can at least keep you accountable.

If no other options are available, even a spouse/partner/friend can act as a surrogate.

Part 6. Personal Development (Pending)

This is the section that all other sections feed into and should be one of the most interactive sections of your plan. Anything that is yet to be tackled, or is work in progress, goes in here. This part will only be as useful as the trader chooses to make it. Paying lip service to it will render it useless.

Part 7. Personal Development (Completed)

This is the section a trader will transfer their development tasks to when completed. Together with Section 3, it will serve as a record of a trader's journey.

So, there we have it, my suggestion for what a trading plan should look like. I'm sure you all have your own opinions about what should or shouldn't be included but I've hopefully set out a version that includes the elements required to make the trading plan a tool that will have continued relevance and usefulness.

I understand many will read this post and decide it's all too much effort. And that's fine. But, for those who want to invest in their futures and aim to become consistently profitable traders, I highly encourage this approach or one like it.

As ever, if you have any comments or questions, please direct them over to my main thread at:
https://www.forexfactory.com/thread/...o-read-markets
 
30
  • Post #22
  • Quote
  • Nov 24, 2020 7:57am Nov 24, 2020 7:57am
  •  LauraT
  • Joined Apr 2020 | Status: Daylight Roadmapper | 1,304 Posts
Section 16 - Advanced/Aggressive Entries

As it's now around 7 months since I first introduced Roadmap, I think it's time to share something that will improve your edge.

Right at the beginning, and ever since, I've maintained that SMA200 should provide your bias and you should therefore only be looking for longs above SMA200 and shorts below it.

However, there is a more advanced/aggressive way to enter, which I think you're now ready to learn.

I can't stress enough though, this is not something I recommend for those new to Roadmap. Get the basics right first, then think about these types of entries. Even experienced traders might decide they are too aggressive and stick with the original plan. That's fine. This is all about giving you an additional option to use, if you wish.

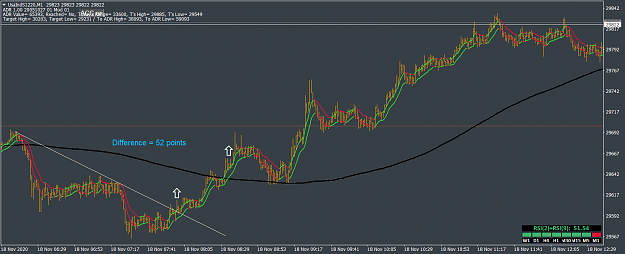
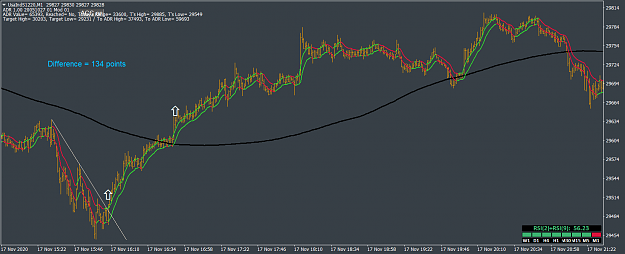
You might have noticed during your chart analysis that trends sometimes begin BEFORE price reaches the 'correct' side of SMA200. Well, now you can take advantage of that. This isn't me saying you can take any old entry at any time. You must still have a solid reason for getting into the trade. But, if you feel you're at the stage where a little freedom will help you, you can have it.

At your disposal you have various tools within Roadmap. If you decide to no longer take your bias from SMA200, make good use of the other tools to guide you. Use trendlines, be aware of price in relation to channel etc etc. And, of course, I'm not suggesting you remove SMA200 from your chart. It's still on mine and likely always will be. You can still use the 8EMA channel to provide you with channel failures or channel crosses. But you now have the option of entering earlier.

With these more aggressive entries comes theoretically extra risk that you will try to enter a trend too early. You must embrace that if you want to trade this way (you must embrace risk if you want to trade - full stop). The rewards, when comparing your potential new entry points with your old entry points, can be significant.

Below I've added two charts to demonstrate entering on a trendline break instead of waiting for SMA200 to be broken. As you can see from the charts, if used correctly, this can increase your edge to a great degree.

As always, please direct any questions or comments to my main thread at:
https://www.forexfactory.com/thread/...o-read-markets

Attached Image (click to enlarge)
Click to Enlarge

Name: adv1.png
Size: 51 KB
Attached Image (click to enlarge)
Click to Enlarge

Name: adv2.png
Size: 52 KB
 
19
  • Post #23
  • Quote
  • Jan 24, 2021 7:58am Jan 24, 2021 7:58am
  •  LauraT
  • Joined Apr 2020 | Status: Daylight Roadmapper | 1,304 Posts
Section 17 - Trading Reversals

It's been a while!

In addition to Roadmap, I've discovered a framework that is useful for identifying potential reversal points. I'm happy to share this with you today.

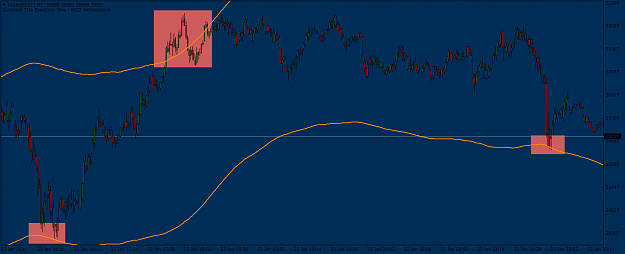
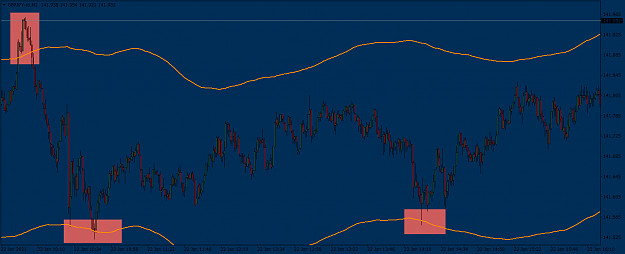
The idea came about when I noticed that, rather than the standard 61.8 Fib retracement, the 70 level offered a high probability turning point. However, I wasn't a fan of drawing lots of Fib retracements on my charts.

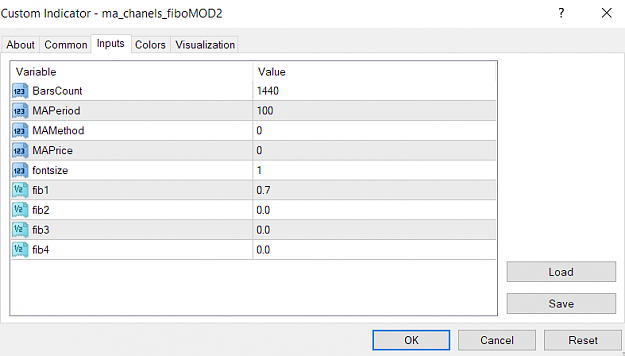
I was aware of the existence of Fibo Bands and wondered if applying that logic to them would yield promising results. It turns out that, with the right settings, a very good degree of accuracy can be obtained.

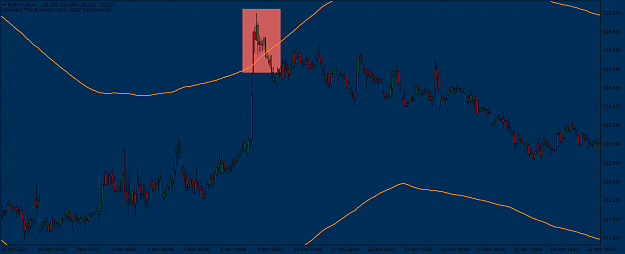
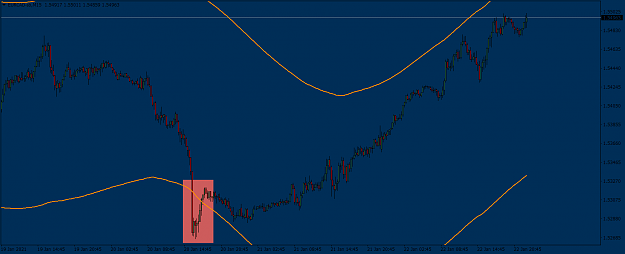
The basic principle is simple. When price approaches the 0.7 level, the chance of a reversal (or at least a significant reaction) occurs. The best part is that the framework can be applied to any instrument on any timeframe. It can either be used as a take profit area for your trades or, if you are an aggressive trader, as an entry point.

Below I've attached the indicator, together with the relevant settings and some charts demonstrating the band in action.

I hope you find this useful and profitable.

Attached Image (click to enlarge)
Click to Enlarge

Name: fiboband4.png
Size: 50 KB
Attached Image (click to enlarge)
Click to Enlarge

Name: fiboband3.png
Size: 41 KB
Attached Image (click to enlarge)
Click to Enlarge

Name: fiboband2.png
Size: 52 KB
Attached Image (click to enlarge)
Click to Enlarge

Name: fiboband1.png
Size: 62 KB
Attached Image (click to enlarge)
Click to Enlarge

Name: Screenshot (41).png
Size: 29 KB
Attached File(s)
File Type: ex4 ma_chanels_fiboMOD2.ex4   15 KB | 1,120 downloads
 
31
  • Post #24
  • Quote
  • May 31, 2021 1:43am May 31, 2021 1:43am
  •  LauraT
  • Joined Apr 2020 | Status: Daylight Roadmapper | 1,304 Posts
Section 18 - Find Your Trading Personality

One thing I say over and over to traders who have yet to reach consistent profitability is that there is no perfect strategy. What works for one person might be disastrous for another. There are various reasons why this is the case, but let's focus on a single area for now. Trader personality.

If a trader is attempting to trade a strategy that contrasts with their personality, it will rarely end in success.

A good way to begin to establish what might work for you is to start with a blank sheet of paper and write down the individual elements which will make up your ideal trading strategy. Not the overall strategy itself, but the nature of the strategy. For example:

Checking charts twice per day, no more than 3 indicators, no moving averages or oscillators, in and out of positions within 2 days, easy to establish a bias, give trades wiggle room etc etc.

The more detail you can add to the nature of your dream strategy, the better. After that, it's simply a case of designing the strategy from scratch in accordance with your preferences.

You can also take one of the multitude of trader personality quizzes out there. Some are better than others, of course. But try to take a selection of them as each one will assist you in getting closer to understanding what motivates and interests you. Some for you to consider are Tharp Trader Test, MarketPsych Trader Personality Test, Daily FX DNA Quiz or Brett Steenbarger's Three Dimensions Trader Personality Quiz.

Most new traders come at this backwards. They search for a strategy before taking time to understand who they are and how they want to trade. But it's never too late to take a new path.

One element of being a consistently profitable trader is managing emotions. This can actually be assisted by matching up your personality with your trading style. If there is no friction between the two, the emotional pains you feel will be greatly reduced.

Any questions or comments can be posted on my main thread at: https://www.forexfactory.com/thread/...o-read-markets
 
15
  • Post #25
  • Quote
  • Jun 27, 2021 1:12pm Jun 27, 2021 1:12pm
  •  LauraT
  • Joined Apr 2020 | Status: Daylight Roadmapper | 1,304 Posts
Section 19 - Seeing The Light

It's been an interesting experience, releasing a further strategy on Forex Factory (https://www.forexfactory.com/thread/...ading-strategy).

I had perhaps forgotten what the early stages of a thread were like. But anyway, here we are. I wanted to take a little time to highlight what I hoped would already be apparent, but maybe it isn't.

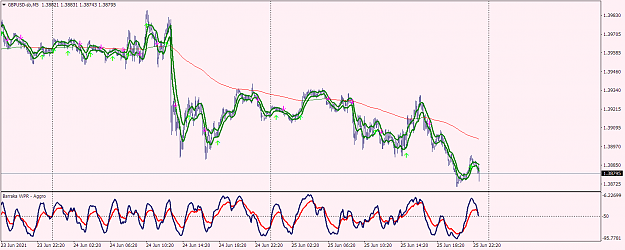
Let's start with the following 3 charts. Which, if any, should you have been looking to trade?

Attached Image (click to enlarge)
Click to Enlarge

Name: ex1.png
Size: 49 KB
Attached Image (click to enlarge)
Click to Enlarge

Name: ex2.png
Size: 67 KB
Attached Image (click to enlarge)
Click to Enlarge

Name: ex3.png
Size: 63 KB


If your answer was example 1 and possibly example 3, you are correct. Example 2 is a definite candidate for avoidance.

So what's the point of that little exercise? Well, it's hopefully to point out in pictorial form what I'm about to say in words.

Daylight is no different to any other strategy in terms of user discretion being required. I hope I've never given the impression that anything I suggest can be blindly traded. It cannot. If, as in example 2 above, there is no direction, Daylight will perform abysmally.

In the charts, you'll notice I added a colour-coded Smoothed 100 moving average. It's green when pointing up, red when pointing down. This is merely a helper if you cannot tell visually whether a market is trending or ranging. Daylight needs trends to flourish. I make no secret of that. Your job, as a trader, is to find the markets which are displaying suitable conditions. The strategy won't do that work for you.

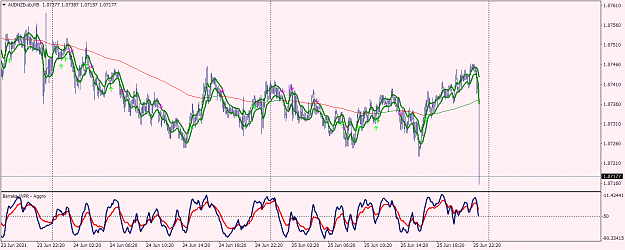
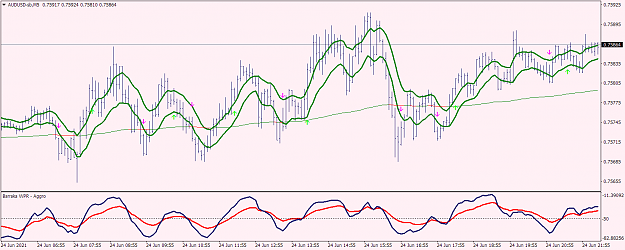
Let's look at AUDUSD from earlier this week:

Attached Image (click to enlarge)
Click to Enlarge

Name: ex4.png
Size: 56 KB


Should you be trading that market based upon what you're seeing unfolding? The answer is hopefully a firm 'NO'. You might get caught out once trying a long but it quickly becomes obvious the market is going nowhere.

Same market, a day earlier:

Attached Image (click to enlarge)
Click to Enlarge

Name: ex5.png
Size: 44 KB


Looks very different, right? This looks like something we can trade profitably to the upside.

The point of these examples is that you need to train your eyes to spot favourable or unfavourable market conditions. Nothing is certain, of course. You can find the perfect conditions and the trade can fail. But what we aim to do is to stack probabilities in our favour. We look for conditions where we have established that, more often than not, a certain outcome will follow.

Please direct any comments or queries to the main thread: https://www.forexfactory.com/thread/...ading-strategy
 
20
  • Post #26
  • Quote
  • Jul 8, 2021 2:38pm Jul 8, 2021 2:38pm
  •  LauraT
  • Joined Apr 2020 | Status: Daylight Roadmapper | 1,304 Posts
Section 20 - Mentoring and Funded Accounts

Today, another of my students achieved funded trader status. I'm obviously very proud of the trader for achieving this and it also allowed me a moment to reflect upon the 15 months that have passed since joining Forex Factory.

Back in April 2020, I jumped onboard the FF train after having been a lurker for many years. I had reached a stage in my trading career where I wanted something more. Making a living from something you love doing is wonderful, of course, but occasionally (especially after many years of doing it) it starts to feel like a repetitive grind.

I wasn't too sure exactly what I wanted. I had a vague idea of presenting one of my trading strategies (Roadmap) and maybe starting a trading group where I could work on helping a small group of individuals to achieve what they desired. And so, I started my first thread and created a Slack group. The response was certainly more than I ever imagined and I quickly realised I had to limit the numbers of this trading group to ensure I was able to devote enough time to each person and, frankly, to avoid working myself into an early grave!

One thing about myself that I haven't shared on FF, until now, is that my health is not the best. Some days I'm fine and I can trade marathon sessions. It's not uncommon for me to be at my trading desk for 12+ hours. Other days, my health lets me down and I have to rest more. With that in mind, I really wasn't sure whether I was being unrealistic in my aims of developing other traders but I persevered.

I have to say, although it's sometimes hard work, the process of helping others to progress has been thoroughly rewarding. I had to make a difficult decision recently and cease supporting the larger numbers we had on Slack. Some members were more active than others so I decided to take the most active people and create a new home in Discord, with all the advantages that platform offers. What was also gratifying about the active members was that most of them were the 'originals', who had been with me since the beginning. Being able to watch them grow and progress is an absolute pleasure.

Anyway, fast forward to today and I now proudly see these individuals all making progress in their own way. Some are trading funded accounts, some their own money. Some are close to where they want to be, others still on the journey. Most are profitable and I had a trader who just reached the milestone of 10 profitable weeks in a row. Some trade Roadmap, some trade Daylight and others trade their own devised strategies. But what all of them have in common is perseverance and loyalty. For those reasons, I'll continue to give everything I can to assist them in getting exactly where they want to.

Which leads me onto funded accounts. I originally was against the concept, seeing it as another way for organisations to fleece under-capitalised traders who had a dream. Of course, prop firms do profit from failed challenges. However, I've come to see that my view was short-sighted and was coloured by my own fortunate position of having sufficient trading capital. For those who don't, I now recognise this is perhaps the only way they will, in relatively short time, be able to trade the size of account that can deliver meaningful consistent income.

Now for the disclaimer, as I know some on FF can be cynical when someone tries to help others, wondering what the ulterior motive is and whether it involves making money from other traders. This post is a genuine reflection upon my time in FF and also a celebration of, and a dedication to, the individuals I work with on a daily basis.

Everything I have provided has been free of charge. I am not seeking new students and I am not setting myself up as a service to help traders achieve funded status.

Let's see what the next 15 months has planned for me
 
44
  • Post #27
  • Quote
  • Jul 9, 2021 8:09am Jul 9, 2021 8:09am
  •  LauraT
  • Joined Apr 2020 | Status: Daylight Roadmapper | 1,304 Posts
Section 21 - Resources for Traders (Guest Post)

Something a little different now. I was asked if I could provide details of some resources for traders and I scribbled a note to aim to sit down and collate what I find useful. Then I had a bright idea - delegate!

I deliberately chose someone I mentor to provide the list below. He takes his performance and his psychology very seriously so I knew readers would be in safe hands with his recommendations.

Here they are:


Books

- All the 'Market Wizards' by Jack Schwager
- Trading in the Zone by Mark Douglas
- Reminiscences of a Stock Operator by Edwin Lefevre
- Market Mind Games by Denise Schull
- Thinking in Bets by Annie Duke
- The Daily Trading Coach by Brett Steenbarger
- Trading for a Living by Alex Elder
- Thinking Fast and Slow by Daniel Kahnman

Podcasts
-The chat with traders podcast

There are so many traders, trading psychologists, money managers and more on this podcast that its too long to list the individual episodes, I would say I've listened to over 100 hours of this podcast.

Youtube
- Patrick Boyle on Finance

Much more of a fundamental grasp of markets how they operate from a former hedge fund manager and lecturer in Kings College London. Covers derivative markets, corporate finance, applied portfolio management, options etc. Admittedly not necessary for day trading but good to have.

- Trader Dante

Former Prop trader from London now full time day trader. This guy has a few videos on his YouTube that are essential watching. He is to the point and does not hold back. Tells you what to work on and what to cut out.

- Rande Howell

Trading psychologist who focuses on building a winning mindset and helping the trader with calming the emotions involved with trading.

UKspreadbetting

- These guys have a pretty big channel that casts a wide net on all aspects of trading but they have a few interviews with some top guys that are worth watching namely:
- David Paul
- Corvin Codirla

Tom Hougaard

- Love this guy’s trading psychology videos and has live trading stream every week.

Courses

I have taken a few courses, most of which are paid for online, but I have found for free in forums/telegrams/torrents, but I have never really learnt an awful lot. They all contain the same stuff just wrapped up differently. Trading contains uncertainty, taking on risk is what produces our returns, therefore there is no holy grail. Screen time is all I can recommend for improving. I literally mean being at your charts and observing the market day in and day out.

Trading Simulator

This is probably my most valuable asset. I can test ideas, replay what happened, observe hundreds of trading days within hours. Observe, come up with theories, test those theories. Practicing this will improve you faster than anything in my opinion.

Mentor

Finally, I've been lucky to have found a mentor. Although they are like finding a needle in a haystack (because these days everyone is selling something), it is no harm to reach out to people on forums and see if they have any interest in talking to you. I would not have found mine without pressing the send button.


So, there we have it. Plenty within there to get your teeth into! Many thanks to the individual who pulled all this together for me. I hope you find some golden nuggets among the suggestions.
 
20
  • Post #28
  • Quote
  • Edited Nov 25, 2021 7:47am Nov 24, 2021 5:13pm | Edited Nov 25, 2021 7:47am
  •  LauraT
  • Joined Apr 2020 | Status: Daylight Roadmapper | 1,304 Posts
Section 22 - Trading Without Charts

I recently carried out an experiment where I traded without any charts. Instead, I used standardised numbers for each market. As the experiment went very well, I thought I'd share details here.

I've long been aware that I'm more of a numbers person than a visual person. At one point in the distant past, I used to trade daily timeframes armed with only an Excel spreadsheet. Although I've done fine with charts over the years, I've always been conscious of them containing a multitude of potential reasons why I shouldn't enter a trade. So, by removing all the visual decision making we unconsciously do when looking at a chart, I wondered if I could still trade successfully.

The sample size is still quite small but, so far, I've actually been outperforming my average profitability since making the switch.

I started with a tool I bought ( https://www.mql5.com/en/market/product/27610 ) but keep reading for a free option if you prefer.

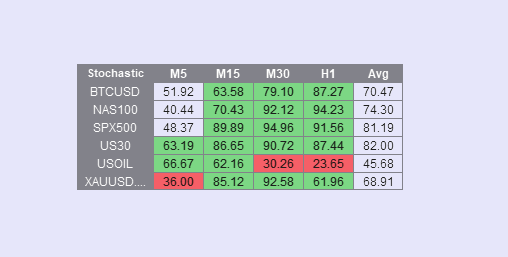
Let's begin with how the dashboard I've been using looks.

Attached Image

You will see that I have a stochastic reading for each market over multiple timeframes. I have the cells colour-coded so that any number above 60 is coloured green and numbers below 40 are coloured red.

The developer was also kind enough to action my request for an Average column. This is simply the total of all timeframes divided by the number of timeframes. Having this option makes my analysis a lot easier, as I can trade using the Average instead of interpreting individual timeframes.

Trading it is simple. I'm entering buys when I see a reading between 60 and 75 or a sell when I see readings between 40 and 25. I prefer not to enter above 75 or below 25 as I worry the move has already happened by that time, but it could be that I am being too cautious. It's early days and I still have more experimenting to do.

Taking profit is an individual thing so I don't want to set out any rules. Only you will know how much profit is enough, whether you want to scale in and/or out of positions etc. In terms of the numbers though, you should exit if you get a reading on the other side of your threshold. So, if you are long, a reading under 40 would tell you it's time to abandon the position (and perhaps even go short if you wish).

After things had been going well for me, I wanted to recommend the way of trading to those in my Discord group but didn't want to make them feel as if they had to spend money on the stochastic dashboard. So, I had a think about what else I could use to get an average of multiple timeframe readings. Then I remembered the Trend Band someone had kindly coded for me on my Roadmap thread. By altering the code to take into account more relevant timeframes, I was able to get a standardised reading.

Unfortunately my coding 'skills' don't extend to being able to remove unnecessary visuals from the tool, so you'll have to put up with them being there. But the only information you need is the composite RSI figure. You can ignore the colour coded boxes.

The way of trading is pretty much the same as the stochastic dashboard. Decide on your thresholds and take entries accordingly. Indicator attached at bottom.

If you want to try this way of trading, the usual caveats apply. Please practice on demo first and then only risk small amounts until you are comfortable and confident in the approach.

I will edit this post with a link to a discussion thread if anyone has any questions or wishes to chat about trading this way.

Discussion thread: https://www.forexfactory.com/thread/...without-charts

Edit - someone has kindly altered the code for me, so that only the relevant RSI reading is displayed.

There are also now options to choose the 3 timeframes you want to average out. Feel free to experiment with those.

I'd also suggest starting with Up value of 60 and Down value of 40.

Attached File(s)
File Type: mq4 RoadMap_TrendBand_Test5.mq4   16 KB | 411 downloads
 
13
  • Post #29
  • Quote
  • Mar 25, 2022 6:01am Mar 25, 2022 6:01am
  •  LauraT
  • Joined Apr 2020 | Status: Daylight Roadmapper | 1,304 Posts
Section 23 - Roadmap Variation

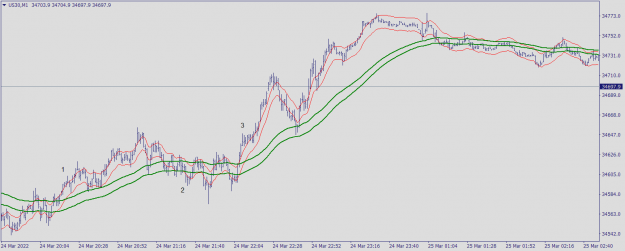
I was tutoring someone recently on scalping and I wanted to do so with a chart that was as clean and simple as possible. Complexity isn't always our friend when it comes to trading decisions.

I think it might be useful to share the chart setup here. Roadmap users will find it quite recognisable but there are two key amendments.

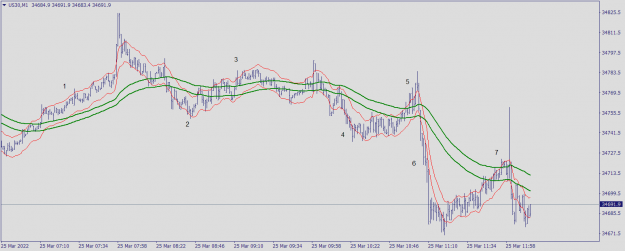
The 200 SMA is replaced by a channel (35 Smoothed High/Low) and the Roadmap channel is replaced by an Envelope (5 smoothed, 0.02% deviation). Nothing else is added to the chart.

Replacing the SMA with a 200 SMA channel (or 100 Smoothed) was an option but, as we were focused on scalping, I wanted something more immediate.

This setup is reactive enough to price behaviour while also avoiding being overly sensitive to market noise.

Enough talk. Let's work through a couple of chart examples:

Attached Image (click to enlarge)
Click to Enlarge

Name: US30M1.png
Size: 41 KB


At point 1, we have a long breakout. Envelope travels fully above channel. The move exhausts itself in the form of a spike in our favour. Remember, such spikes are always profit taking opportunities (or partial profits) as they will frequently retrace or reverse. Probably around 40 points profit in the move.

Point 2 is a short breakout. With Roadmap trades, I usually say a fresh cross is a good opportunity as it attracts new momentum and participants. However, with this chart setup, it will rarely be the most optimal entry point. As you can see, price retraces back up to point 3. This is our ideal entry area. Why? Because we are proven wrong very inexpensively. If the envelope were to go fully above the channel, we would take a small loss.

The pattern repeats itself with breakouts at points 4 and 6 and optimal entry opportunities at 5 and 7.

Attached Image (click to enlarge)
Click to Enlarge

Name: US30M1b.png
Size: 39 KB


The second chart shows 3 potential long entry points. Which is best or worst?

2 is best. 3 is next best. 1 is worst. Why?

2 is best for reasons described already. 3 is better than 1 as the trend is already established and this is a good continuation setup. 1 has the most overall profit potential but also the highest risk.

As always, if there are comments or questions, please feel free to write over on the Roadmap thread:
https://www.forexfactory.com/thread/...o-read-markets
 
14
  • Post #30
  • Quote
  • Jul 6, 2022 8:17pm Jul 6, 2022 8:17pm
  •  LauraT
  • Joined Apr 2020 | Status: Daylight Roadmapper | 1,304 Posts
Section 24 - Beyond Support & Resistance

I was asked a very reasonable question here: https://www.forexfactory.com/thread/...5#post14057325

Although I hate appearing mysterious or to be holding things back, this opens a can of worms due to a decision I made about posting here. In section 8 of this journal I set out a VERY basic strategy for being aware of certain levels within a market.

There's what I've shared here on FF and there's what I've shared in private elsewhere. For various reasons, I prefer it that way. The subject gets quite involved and discussion can get rather emotive, especially when my views challenge what people consider truisms about markets. To be frank, I don't have the time or inclination to expound upon, defend or argue my perspective on a lot of the topic. I have admiration for those who spend hours setting out their theories and debating them with others but it's simply not how I enjoy directing my focus.

So, with all that said, let's scratch the surface a tiny bit deeper. It's still a rather basic overview but it will hopefully give some food for thought.

Let's begin by considering what markets are. There are a thousand answers people can give when asked to describe a financial market but, in my view, there is one fundamental core description that 'explains' everything that follows.

Markets are liquidity seeking appliances. For a market to function, there has to be a continuous flow of orders. This is achieved by visiting certain levels, often repeatedly.

So what is support/resistance or supply/demand? In my opinion they are deliberately created price points that exist for both immediate and future reasons.

Once you start looking at markets from a liquidity perspective, a lot changes. It opens up new ways of interpreting price action (and renders some beliefs redundant).

Suppose there is a market in bananas. A banana, let's say, sells for $1 currently. A look at your banana chart tells you that the recent high price was $1.10 and the low was $0.90. What happened at those two levels? And what are the after-effects? Well, think in terms of liquidity. They were turning points but why? Partly for the obvious reason that buyers or sellers became more aggressive in their order flow but what have they created? Points of structure.

Now, back to your banana chart. Price is now $1.04. Where is the closest pool of liquidity? At $1.10 or around that level. Why? Because, when a point of structure is created, it contains and then attracts orders. Firstly, there are the trapped traders. Those unlucky people who decided to buy at $1.10, only to see the market immediately reverse on them. Some people take a loss and move on but there are a significant proportion of traders who refuse to do so. They tell themselves that they will only get out when price comes back to their entry level.

They bought at $1.10 so they put a resting sell order to close their position at the same level. That is liquidity. Now we come to the chart analysts. They see the high of $1.10 and decide it's a mighty fine place to put their stop after they sold. So that would be a buy order (to close a sell). This is also liquidity. Then there are the breakout traders. They look at the chart and decide that if the market makes a new high they should be buying. So they place pending buy orders at just above the high. This is also liquidity.

I won't labour the point by keeping going on about bananas but hopefully you can see what I'm trying to say. Whatever or whoever controls the banana market knows there will be liquidity around $1.10. And, as markets are liquidity seeking in nature, it's a fair assumption to expect price to return to that level to grab the liquidity. Often before immediately reversing again to go in search of downside liquidity. And so the pattern repeats, over and over.

I've spoken about the relevance of market structure before but this is exactly why market structure has limitations and can actually mislead traders. People see a marginal new high and assume the market is bullish. But it might be the opposite. Once the liquidity at that high is cleared out, the market might have no interest in going higher as it knows liquidity is limited up there.

I may say more on this topic in future but, for now, I think that's enough of an overview. Hopefully it illuminates rather than confuses!

As ever, please post any queries or comments in my main thread here: https://www.forexfactory.com/thread/...o-read-markets
 
18
  • Post #31
  • Quote
  • Last Post: Jul 10, 2022 11:13pm Jul 10, 2022 11:13pm
  •  LauraT
  • Joined Apr 2020 | Status: Daylight Roadmapper | 1,304 Posts
Section 25 - Liquidity Clearouts & Roadmap

In the last section I set out what was hopefully a pretty simple overview of why liquidity matters. In this section I want to show a very basic element of liquidity that will serve you well in trading, and at the same time it will hopefully shed some light on why Roadmap trades suddenly turn around on you.

The truth is, Roadmap is just one of the many approaches I trade. It's also not a black and white strategy. If you become too rigid in your thinking, Roadmap will fail you. It was always meant to be a starting point rather than a complete picture. It's no surprise that those who are profiting most from it have taken pieces from it, added some of their own, and designed a strategy that suits their personalities and schedules.

I've also become conscious recently that I've probably done a disservice to Roadmap followers by not expanding on what has already been shared. Roadmap has depth beneath what might appear a quite straightforward surface - it has nuances that only years of trading it will reveal. But it also works better when the person using it has a rounded view of financial markets. That's where I perhaps need to do more and share more.

So, let's begin with one strand of liquidity. Where it is, and when it no longer is. I explained in the last post how liquidity is created (by you and I) - now let's look at some examples of where it's created and how it's later removed (and why this is very relevant to Roadmap traders).

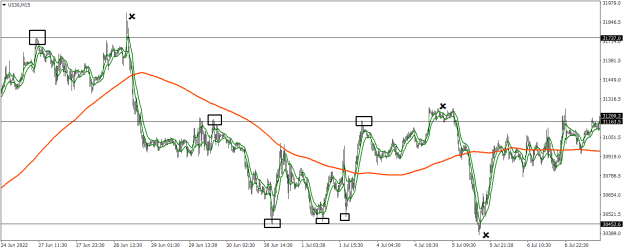
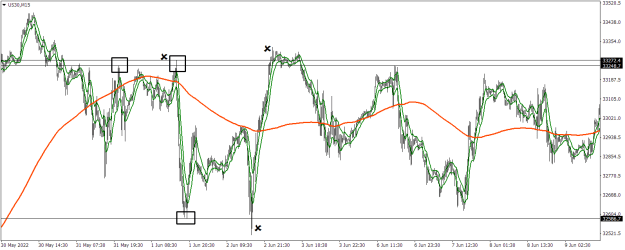
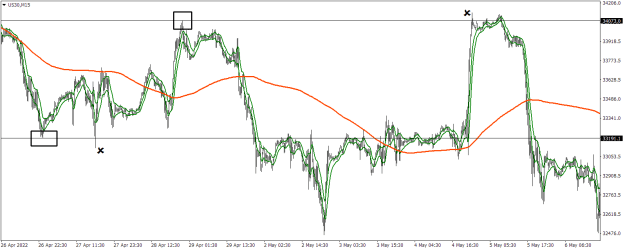
In the charts below, you will see boxes and Xs - the boxes are the formation of liquidity and the Xs are the clearouts of that liquidity. I have removed a lot of the Roadmap tools but left the channel and SMA, so things are easier to see.

Attached Image (click to enlarge)
Click to Enlarge

Name: BR1.png
Size: 24 KB

Attached Image (click to enlarge)
Click to Enlarge

Name: BR2.png
Size: 26 KB

Attached Image (click to enlarge)
Click to Enlarge

Name: BR3.png
Size: 24 KB


You should almost immediately begin to see why Roadmap itself is not enough. Without taking into account where the liquidity is (and when it's cleared) you are flying in the dark somewhat.

So what can we take from the creation and subsequent clearout of a liquidity pool? Two things. Targets and reversals.

Let's say you are long on the third chart, from the channel cross on 3rd May. The first question to ask yourself is "where is the liquidity the market seeks?" - this gives you a potential target. The market obliges and runs up to your target the next day. You now have around 900 points floating profit - congratulations!

This is where you ask yourself the next question: "will this be a clearout of liquidity to fuel a reversal or will it be an absorption of liquidity to fuel a continuation?" - mostly, we simply will not know. So you take a big chunk of your profit off the table or you adjust your stop to lock in most of it.

Keep in mind, Roadmap is blissfully unaware of all this. It's still saying you should be long. But this is the type of area where I absolutely love being a seller. Let's take a step back for a second and remind ourselves of what most of the liquidity will be up there. Buy or sell orders??

If you said buy orders you're correct. Two types - stop orders from the bears (buy orders to close a sell order) and pending orders from the breakout traders. Sure, there will be some sell orders there too but those will be significantly outnumbered. So, the market seeks liquidity and the liquidity up there is mostly in the form of buy orders. Those two pieces of knowledge give us a huge advantage over people who are trading momentum or some flashing arrow buy/sell strategy or whatever.

Why would the market seek out a pool of buy orders? That's the next question to ask yourself.

One reason is that someone has a very large sell order to execute. Large orders are not like our retail orders, they aren't placed in one or two parts. They can't be. Why? Because there wouldn't be the counterparty volume to absorb them without significantly impacting price. So I'm working for XYZ Bank and I have a huge sell order sitting on my book - what do I do? I try to encourage price to seek out a bundle of buy orders to soak it up. Which incidentally takes us onto a slight tangent but it's worth mentioning. Big money will often 'buy to sell' - that is, they might allocate a proportion of their funds to taking the opposite side of the one they intend to finally take. But we'll get into all that in more detail another time.

Can you see why I love to sell in those areas? All i'm doing is trying to ride the coat tails of the big money. If i'm wrong, my risk is limited by whatever I decide my tolerance is. If I'm right, the sky is the limit and I can go around showing everyone that I sold the top

More to say in future, but I hope this has given you a few things to think about.

As ever, please post any comments or queries over on my Roadmap thread: https://www.forexfactory.com/thread/...o-read-markets
 
16
  • Trading Journals
  • /
  • Just A Journal
  • Reply to Thread
    • 1 Page 2
    • 1 Page 2
0 traders viewing now
Top of Page
  • Facebook
  • Twitter
About FF
  • Mission
  • Products
  • User Guide
  • Media Kit
  • Blog
  • Contact
FF Products
  • Forums
  • Trades
  • Calendar
  • News
  • Market
  • Brokers
  • Trade Explorer
FF Website
  • Homepage
  • Search
  • Members
  • Report a Bug
Follow FF
  • Facebook
  • Twitter

FF Sister Sites:

  • Metals Mine
  • Energy EXCH
  • Crypto Craft

Forex Factory® is a brand of Fair Economy, Inc.

Terms of Service / ©2023