Hi,
Last week I shared a dashboard for those who follow Laura's Daylight thread:
https://www.forexfactory.com/thread/...ading-strategy
There are other requests that have popped up, including the ability to display signals. I have therefor coded another tool, this time it's an indicator that displays the moving averages for the %R sub-window. In essence, it replaces the need to have the normal William's %R indi, hide the normal line, and apply the 2 moving averages.
The value here is that you can back-test more easily, because this indicator displays the signals that would have been generated following the rules from "Daylight".
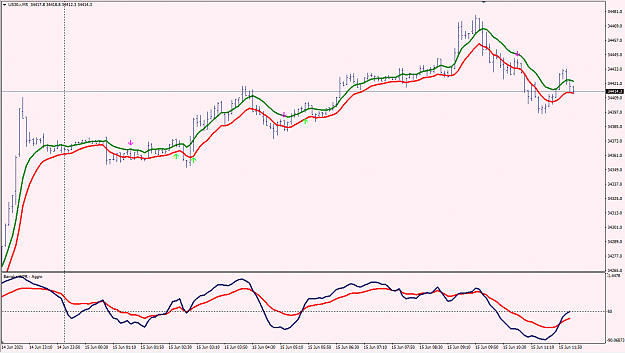
Here is what it looks like:
I have Laura's template on the main chart, so yours might look different.
The indicator is the bottom window, you need to display you own moving average for the main chart, depending on what version you use (standard or aggressive). But that should not be too difficult.
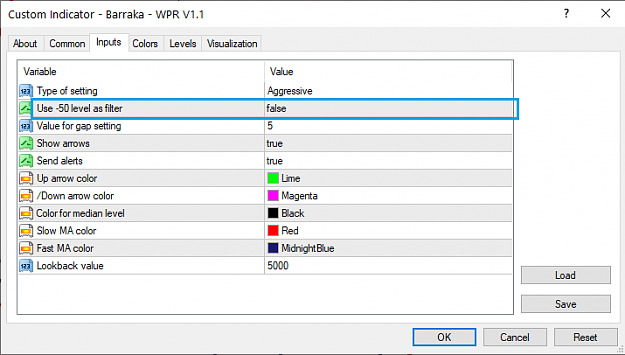
Brief walk-through of the settings:
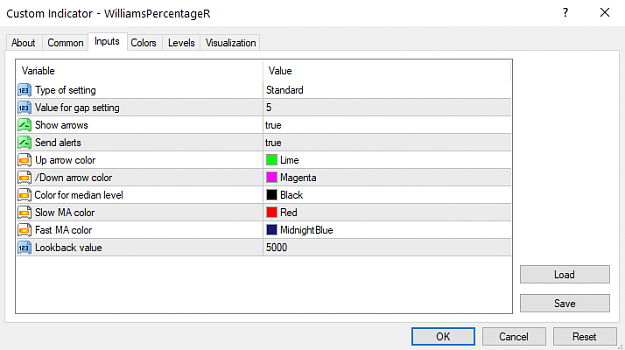
- The main element to change is the first one, depending on what you want to track / backtest. The 2 choices are "Standard" and "Aggro", if you're not sure what they mean please refer to Laura's thread, post #1.
- The "gap" setting is the value between the 2 MA's (red and blue) in the sub-window, where "daylight" appears. Above that value, there can be signals, below that value, it's considered as no daylight.
The rest is pretty straightforward.
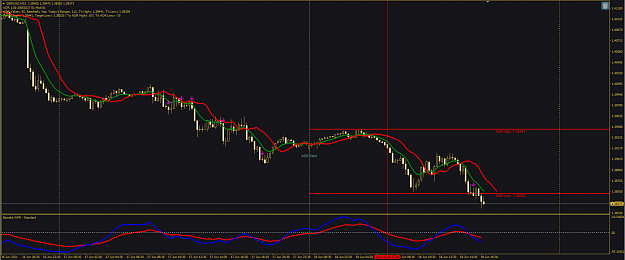
Here is the comparaison, for the same chart, between the Standard:
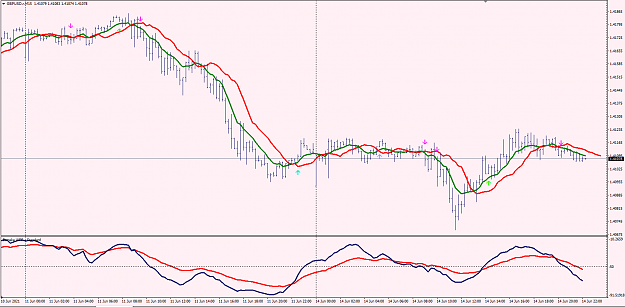
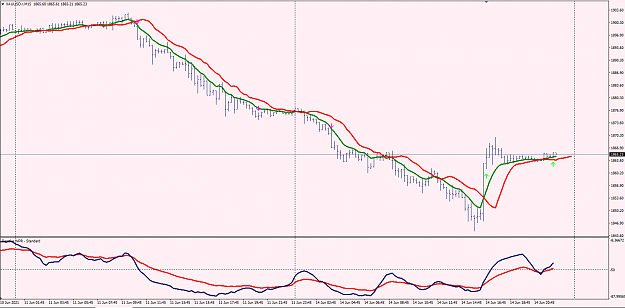
and Aggro:
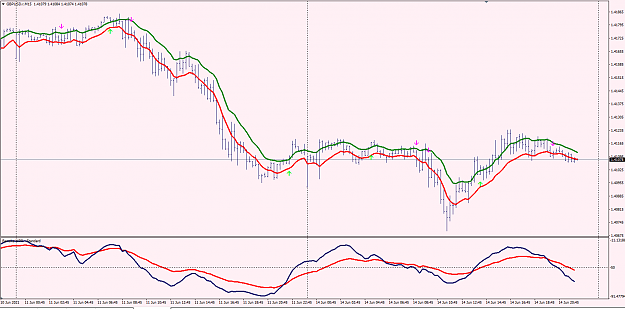
When there are more than 1 signal arrow on a certain move, it's because at some point the distance between the red & blue MA reduces and there is no "daylight", so it can even be used as a re-entry after a pullback for example.
Just to re-iterate to be clear: whether you chose the "Standard" or the "Aggro" version, it doesn't matter what kind of MAs you have on your chart as it's calculated independently, so when you switch from one to the other, remember to change the chart MA settings, as per the thread rules.
Green pips,
Last week I shared a dashboard for those who follow Laura's Daylight thread:
https://www.forexfactory.com/thread/...ading-strategy
There are other requests that have popped up, including the ability to display signals. I have therefor coded another tool, this time it's an indicator that displays the moving averages for the %R sub-window. In essence, it replaces the need to have the normal William's %R indi, hide the normal line, and apply the 2 moving averages.
The value here is that you can back-test more easily, because this indicator displays the signals that would have been generated following the rules from "Daylight".
Here is what it looks like:
Attached Image (click to enlarge)
I have Laura's template on the main chart, so yours might look different.
The indicator is the bottom window, you need to display you own moving average for the main chart, depending on what version you use (standard or aggressive). But that should not be too difficult.
Brief walk-through of the settings:
Attached Image (click to enlarge)
- The main element to change is the first one, depending on what you want to track / backtest. The 2 choices are "Standard" and "Aggro", if you're not sure what they mean please refer to Laura's thread, post #1.
- The "gap" setting is the value between the 2 MA's (red and blue) in the sub-window, where "daylight" appears. Above that value, there can be signals, below that value, it's considered as no daylight.
The rest is pretty straightforward.
Here is the comparaison, for the same chart, between the Standard:
Attached Image (click to enlarge)
and Aggro:
Attached Image (click to enlarge)
When there are more than 1 signal arrow on a certain move, it's because at some point the distance between the red & blue MA reduces and there is no "daylight", so it can even be used as a re-entry after a pullback for example.
Just to re-iterate to be clear: whether you chose the "Standard" or the "Aggro" version, it doesn't matter what kind of MAs you have on your chart as it's calculated independently, so when you switch from one to the other, remember to change the chart MA settings, as per the thread rules.
Green pips,
Attached File(s)