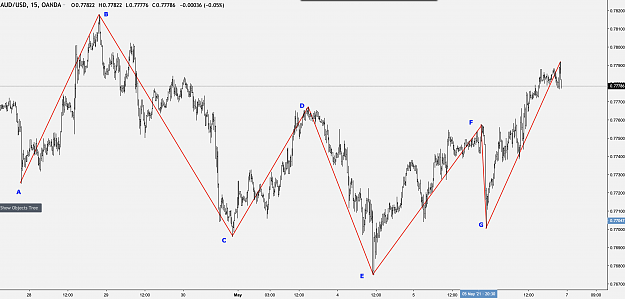
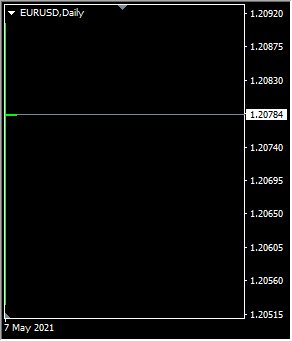
Disliked{quote} Please don't get angry if this is too demanding. {image} Are these swing levels correct?Ignored
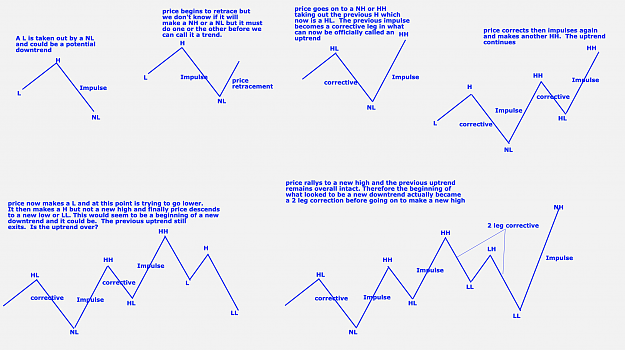
Let's review so we don't lose sight of some of the basics of trends
1. First we are looking at the visual representation of trends on a price chart and in the end how this can help use trade and make money.
2. Most simply an uptrend is when price is going up for the most part and a down trend is when price is going down for the most part.
3. An uptrend is any segment where price is making HHs and HLs and a downtrend is any segment where price is making LLs and LHs. (This is so simple yet immensely important because it is this concept that should underly every trading strategy)
4. Trends have components. The impulse leg is the portion that moves to make a new high in an uptrend or a new low in a downtrend. The corrective leg is the portion where price retraces after making a new high or new low before then resuming and going on to make a new high or new low.
While the definitions are objective applying them to a price chart can involve a degree of subjectiveness because of the following:
1. The amount of data on our chart (another way to say this is how zoomed in or zoomed out is our chart)
2. The size of swings chosen. It is possible to draw swings between each bar or candle, then we can move on to small multibar swings and then bigger multibar swings. Neither is necessarily correct or incorrect. It's just what each of us chooses to trade with. This gets to traders who want very definitive answers to what is correct and not correct.
3