Hi guys.I just want to share my basic understanding about supply and demand in economy and how i use it for Forex trading.Hope can share and learn from all of u as i learn from others.This is just beginning of price action understanding.If u want more can view RED n TRADE PRICE thread.
Back to basic
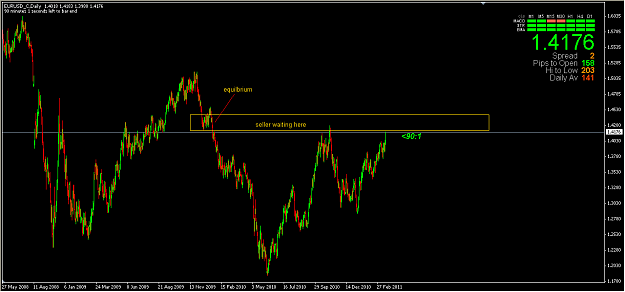
Perhaps you remember the two people whose names figure often mentioned in the discipline of economics and physical. The first was Adam Smith, the pioneer of modern economics and a pioneer of economic system of capitalism. He has stated hundreds of years ago that if supply exceeds demand at a certain price level, prices will fall, and vice versa. While the second is Sir Isaac Newton's law of motion states that an object will remain in action motion (motion) to obtain reaction force (force) is equal to or greater. More often called the Action and Reaction only. Both examples are simple but wise of all time-tested and directly was a major factor in price movements in the market that we are trading and engaging in it at this time. The focus of this paper is on what is called the conventional technical analysis as a support (demand) and resistance (supply). We will examine more in what support and resistance are, how we identify and quantification on the chart, and how to use them in making objective decisions so as to produce profitable trading.
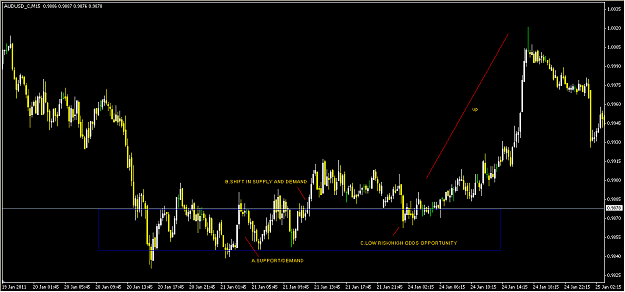
A trader should understand that the market mechanism is no more and no with other market we know. We have seen how the law of supply demand to work with human factors involved. This is the main staple driving prices, and opportunities arise when these simple relationships become unbalanced. If only we are willing to observe the interaction of supply and demand is always there every time, should the identification process will reverse the direction the price is not too difficult.
Back to basic
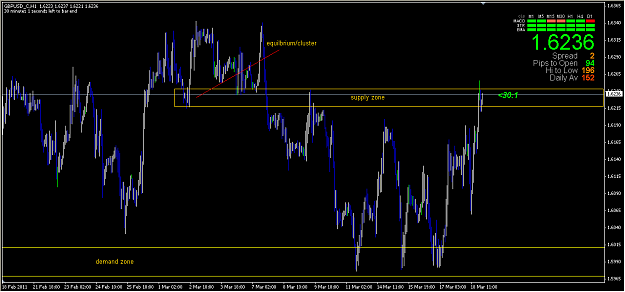
Perhaps you remember the two people whose names figure often mentioned in the discipline of economics and physical. The first was Adam Smith, the pioneer of modern economics and a pioneer of economic system of capitalism. He has stated hundreds of years ago that if supply exceeds demand at a certain price level, prices will fall, and vice versa. While the second is Sir Isaac Newton's law of motion states that an object will remain in action motion (motion) to obtain reaction force (force) is equal to or greater. More often called the Action and Reaction only. Both examples are simple but wise of all time-tested and directly was a major factor in price movements in the market that we are trading and engaging in it at this time. The focus of this paper is on what is called the conventional technical analysis as a support (demand) and resistance (supply). We will examine more in what support and resistance are, how we identify and quantification on the chart, and how to use them in making objective decisions so as to produce profitable trading.
A trader should understand that the market mechanism is no more and no with other market we know. We have seen how the law of supply demand to work with human factors involved. This is the main staple driving prices, and opportunities arise when these simple relationships become unbalanced. If only we are willing to observe the interaction of supply and demand is always there every time, should the identification process will reverse the direction the price is not too difficult.
Gold Expedition Return This Year:
-15.9%