https://youtu.be/6avJHaC3C2U
https://youtu.be/RMpP8XeJ8kY
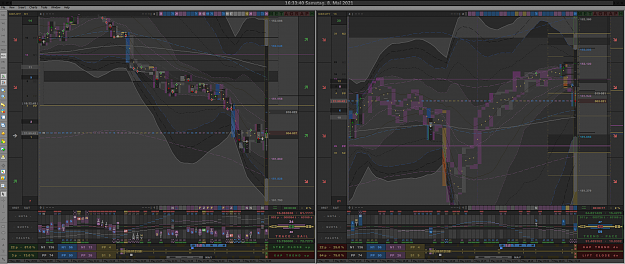
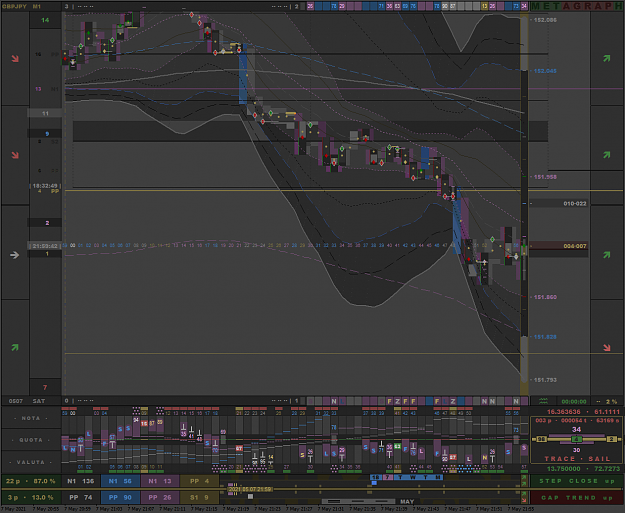
to explain what is to see by observing market through the METAGRAPH would be like having to explain what is to see by observing life through before never used optics.
One only can recognize something if it is made recognizable in advance. This is done by METAGRAPH in bringing pricely dependencies in timely relations. Extended by the Volume the current tension shows how market plays with the pedal.
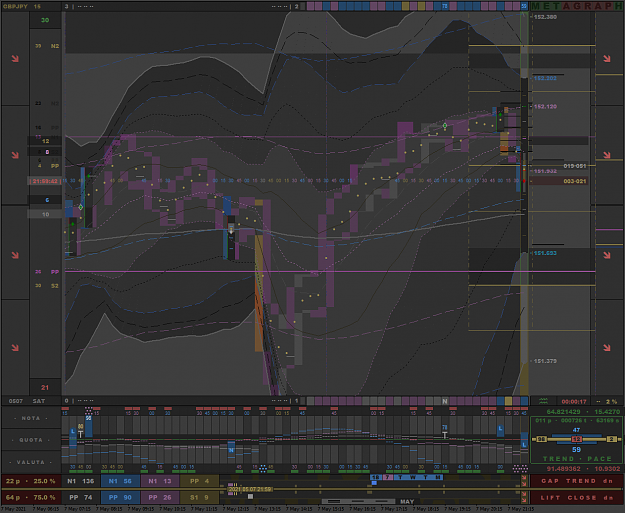
We have two movements on the chart: a time-cycle OC and a price-move HL. Thus time shows price and price shows time. Because a pricely-period-movement is opened and closed by time, and with high and low the pricely range finds its edges in the separate timely-moving-cycle.
With the functions of the PENs the exact timepoint of such events is made visible, because one tactic for market to make a buck is to cut ranges and to shift time. But robots are dumb and blind, so they have to be told what next to do. With the PEN in relation within its environment this announcement is pretty clear visible. Observing the tic-behaviour when the signals come in gives then the exact moment of becoming active.
And with this technique market can hold back information to the maximal possible moment, thus staying flexible for most latest possible changes in mind and intent. What it does pretty obviously, surely no-one here who can fight this argument..
Fundamental is, to accept and work with realities.
Every reality exisiting in our universe world is stored in form of numbers. By building relations between these numbers dependencies and resulting functions are formed. These things are what is called a graph. Humans recognition of such a graph is called „picture“, ergo the things we can see.
So with METAGRAPH you have a highly sensitive scientific lens-system showing the work of synthesizer market.
In price. And time. Music made visible. Clocked to the tic.
Time to discover the never-seen-before by giving the screen the needed information for fundamental decisions. It will show things nowhere can be read anything about, because these are the things which are definitely not subject to be talked about by the ones who have arranged that automat. And their army is leading everyone there where one definitely is far enough away from any possibility to find these things out. There where clean charts show a rudimentary plot of obfuscated values..
Better called nothing..
METAGRAPH multilateral market monitor
PLAYING EMPTY CHARTS OR NOT?
https://youtu.be/RMpP8XeJ8kY
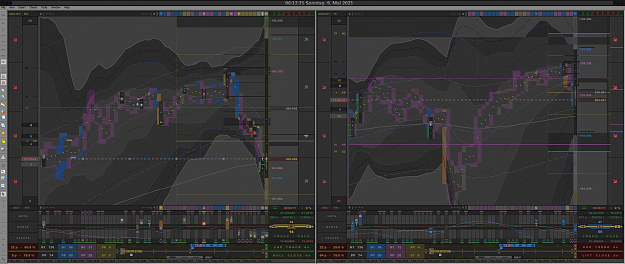
to explain what is to see by observing market through the METAGRAPH would be like having to explain what is to see by observing life through before never used optics.
One only can recognize something if it is made recognizable in advance. This is done by METAGRAPH in bringing pricely dependencies in timely relations. Extended by the Volume the current tension shows how market plays with the pedal.
We have two movements on the chart: a time-cycle OC and a price-move HL. Thus time shows price and price shows time. Because a pricely-period-movement is opened and closed by time, and with high and low the pricely range finds its edges in the separate timely-moving-cycle.
With the functions of the PENs the exact timepoint of such events is made visible, because one tactic for market to make a buck is to cut ranges and to shift time. But robots are dumb and blind, so they have to be told what next to do. With the PEN in relation within its environment this announcement is pretty clear visible. Observing the tic-behaviour when the signals come in gives then the exact moment of becoming active.
And with this technique market can hold back information to the maximal possible moment, thus staying flexible for most latest possible changes in mind and intent. What it does pretty obviously, surely no-one here who can fight this argument..
Fundamental is, to accept and work with realities.
Every reality exisiting in our universe world is stored in form of numbers. By building relations between these numbers dependencies and resulting functions are formed. These things are what is called a graph. Humans recognition of such a graph is called „picture“, ergo the things we can see.
So with METAGRAPH you have a highly sensitive scientific lens-system showing the work of synthesizer market.
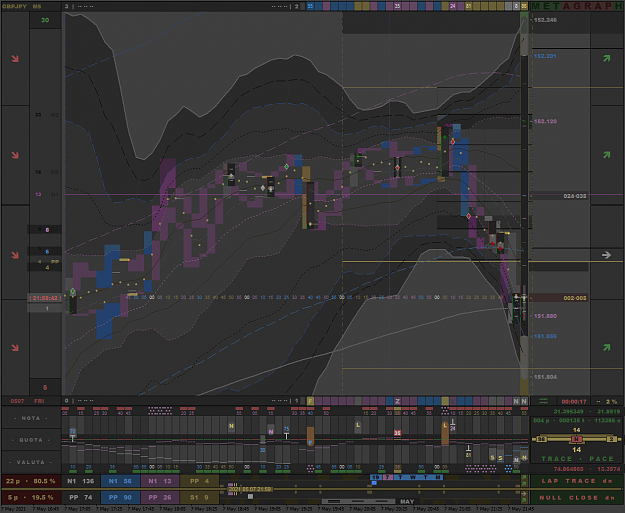
In price. And time. Music made visible. Clocked to the tic.
Time to discover the never-seen-before by giving the screen the needed information for fundamental decisions. It will show things nowhere can be read anything about, because these are the things which are definitely not subject to be talked about by the ones who have arranged that automat. And their army is leading everyone there where one definitely is far enough away from any possibility to find these things out. There where clean charts show a rudimentary plot of obfuscated values..
Better called nothing..
METAGRAPH multilateral market monitor
Attached Image (click to enlarge)
Open where needed. Close where feeded.