My heartfelt thanks to all the wonderful folks from whom i had learnt over the years - how to trade and how not to trade.
Steps:
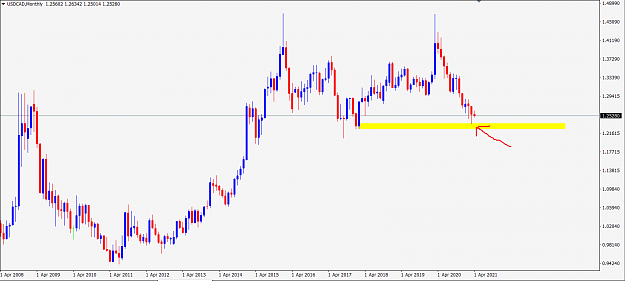
1. Perform PA analysis on Higher timeframes (D1, W1, MN) to determine the direction of the main PA
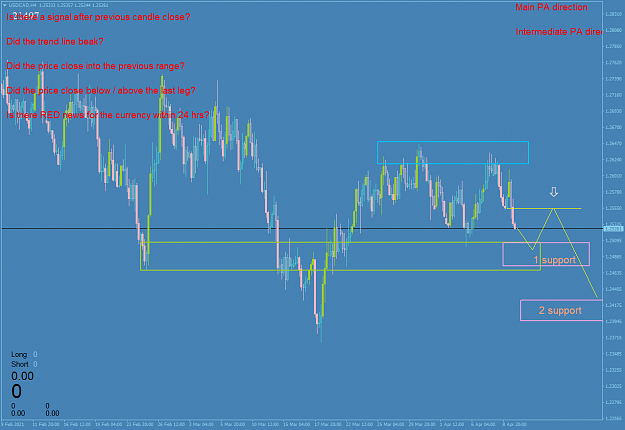
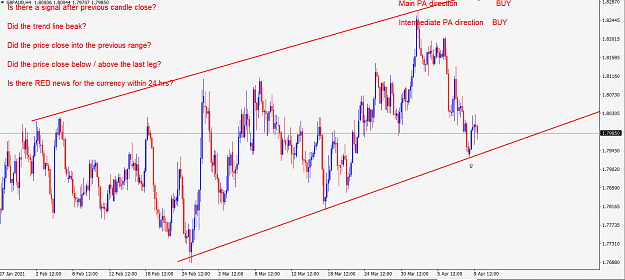
2. Perform PA analysis on H4 timeframe to determine the direction of the intermediate PA
3. Determine if a Marubozu like candle is formed on H4.
4. Enter trade on the next candle (after Marubozu like candle is formed)
5. Always follow proper money and risk management. Calculate how much capital you are risking before entering any trade.
6. Exit the trade for a
Profit: If price reaches a major PA on H4 or breaks the trend line / fan in the opposite direction
Loss: If the price closes above the previous PA (for SELL) or below the previous PA ( for BUY )
7. I found the following questions / rules to be helpful before entering a trade:
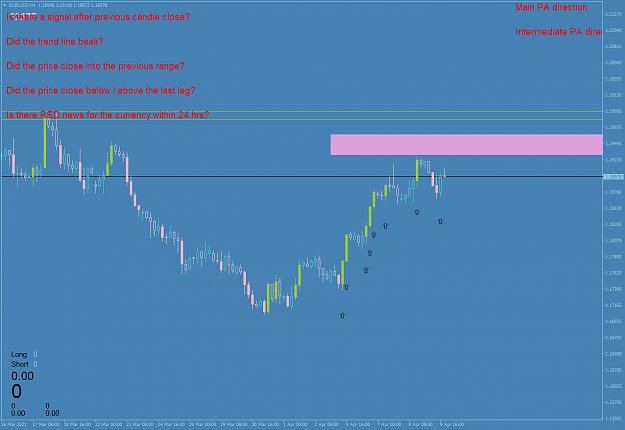
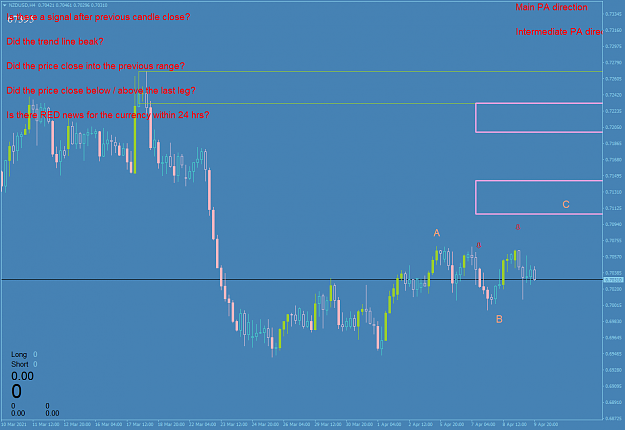
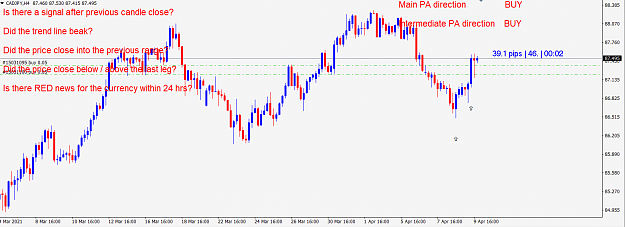
a. Is there a signal after previous candle close? ( I enter a trade if i see an arrow within the previous few candles)
b. Did the trend line break?
c. Did the price close into the previous range?
d. Did the price close above / below the last leg of movement?
e. Is there RED news for the currency within 24 hours?
High probability trades would have the following answers: ( I do not enter a trade until the answers are as below)
7 (a) - YES
7 (b) - YES
7 (c) - YES
7 (d) - YES
7 (e) - NO
I will add more details with examples as i continue to forward test this approach. Unfortunately, the way the indicator is created, only Forward trading / testing is
useful.
I have put together an indicator that works for me. This indicator needs manual input (Main PA direction, Intermediate PA direction).
I plan on updating this Indicator at least 2 times every day with my analysis (Step 1 and Step 2). If you see a more recent update here, please download and update at your end.
The Arrow appears when Marubozu like candle forms on the chart. (Step 3)
The indicator is a simple tool that helps me to analyze around 20+ pairs faster than doing them all individually and manually. This is not an EA or an automated indicator.
If you find the indicator useful, please use it but be aware that there is not much automation in this and it depends 95% on manual analysis and updates.
This indicator may not be for every one.
The source is provided "as is". Please feel free to use it "as is" or modify to fit your purpose.
This indicator has been tested only with 5 digit / 3 digit (after decimal) price charts. It may not work on 4 digit / 2 digit (after decimal) price charts. Please let me know if it does not work and i can check.
This indicator works ( for now ) on the following symbols only:
USDCHF, GBPUSD, EURUSD, USDJPY, USDCAD, AUDUSD, EURGBP, EURAUD, EURCHF, EURJPY, GBPCHF, CADJPY, GBPJPY,
AUDNZD, AUDCAD, AUDCHF, AUDJPY, CHFJPY, EURCAD, CADCHF, NZDJPY, NZDUSD, GBPAUD, GBPCAD, NZDCAD, NZDCHF
XAUUSD, BTCUSD, LTCUSD, ETHUSD
Arrow is not an indication to BUY or sell Immediately. It only indicates the formation of a "Marubozu like" candle which increases the probability of a move in that direction.
As always, please be courteous to your fellow traders. The goal is to learn, improve and add value to your trading.
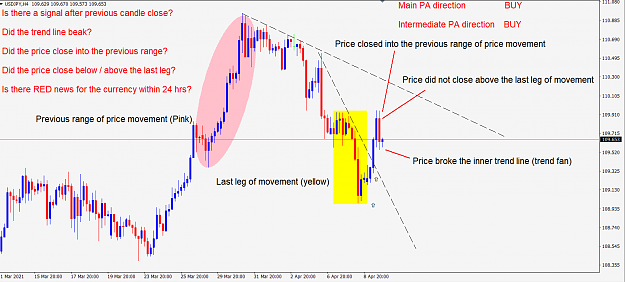
Example of a trade:
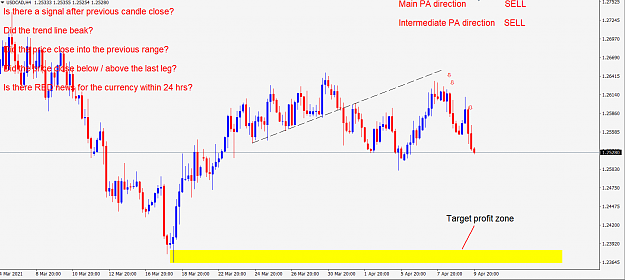
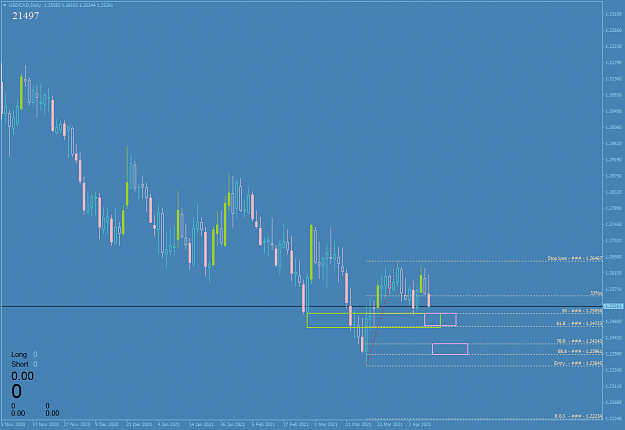
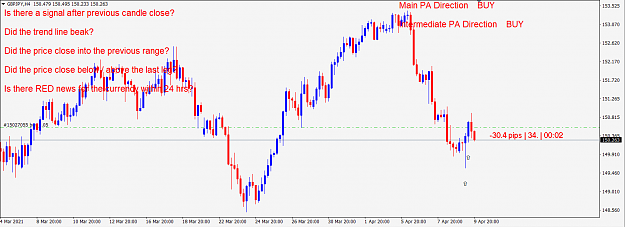
Example of how not to trade: Why? The answers to 7 (c) and 7 (d) are NO - as you can see in the chart.
The price did not close back into the previous range and the price did not close above the last leg of downward movement.
Steps:
1. Perform PA analysis on Higher timeframes (D1, W1, MN) to determine the direction of the main PA
2. Perform PA analysis on H4 timeframe to determine the direction of the intermediate PA
3. Determine if a Marubozu like candle is formed on H4.
4. Enter trade on the next candle (after Marubozu like candle is formed)
5. Always follow proper money and risk management. Calculate how much capital you are risking before entering any trade.
6. Exit the trade for a
Profit: If price reaches a major PA on H4 or breaks the trend line / fan in the opposite direction
Loss: If the price closes above the previous PA (for SELL) or below the previous PA ( for BUY )
7. I found the following questions / rules to be helpful before entering a trade:
a. Is there a signal after previous candle close? ( I enter a trade if i see an arrow within the previous few candles)
b. Did the trend line break?
c. Did the price close into the previous range?
d. Did the price close above / below the last leg of movement?
e. Is there RED news for the currency within 24 hours?
High probability trades would have the following answers: ( I do not enter a trade until the answers are as below)
7 (a) - YES
7 (b) - YES
7 (c) - YES
7 (d) - YES
7 (e) - NO
I will add more details with examples as i continue to forward test this approach. Unfortunately, the way the indicator is created, only Forward trading / testing is
useful.
I have put together an indicator that works for me. This indicator needs manual input (Main PA direction, Intermediate PA direction).
I plan on updating this Indicator at least 2 times every day with my analysis (Step 1 and Step 2). If you see a more recent update here, please download and update at your end.
The Arrow appears when Marubozu like candle forms on the chart. (Step 3)
The indicator is a simple tool that helps me to analyze around 20+ pairs faster than doing them all individually and manually. This is not an EA or an automated indicator.
If you find the indicator useful, please use it but be aware that there is not much automation in this and it depends 95% on manual analysis and updates.
This indicator may not be for every one.
The source is provided "as is". Please feel free to use it "as is" or modify to fit your purpose.
This indicator has been tested only with 5 digit / 3 digit (after decimal) price charts. It may not work on 4 digit / 2 digit (after decimal) price charts. Please let me know if it does not work and i can check.
This indicator works ( for now ) on the following symbols only:
USDCHF, GBPUSD, EURUSD, USDJPY, USDCAD, AUDUSD, EURGBP, EURAUD, EURCHF, EURJPY, GBPCHF, CADJPY, GBPJPY,
AUDNZD, AUDCAD, AUDCHF, AUDJPY, CHFJPY, EURCAD, CADCHF, NZDJPY, NZDUSD, GBPAUD, GBPCAD, NZDCAD, NZDCHF
XAUUSD, BTCUSD, LTCUSD, ETHUSD
Arrow is not an indication to BUY or sell Immediately. It only indicates the formation of a "Marubozu like" candle which increases the probability of a move in that direction.
Attached File(s)
Attached File(s)
As always, please be courteous to your fellow traders. The goal is to learn, improve and add value to your trading.
Example of a trade:
Attached Image (click to enlarge)
Example of how not to trade: Why? The answers to 7 (c) and 7 (d) are NO - as you can see in the chart.
The price did not close back into the previous range and the price did not close above the last leg of downward movement.
Attached Image (click to enlarge)