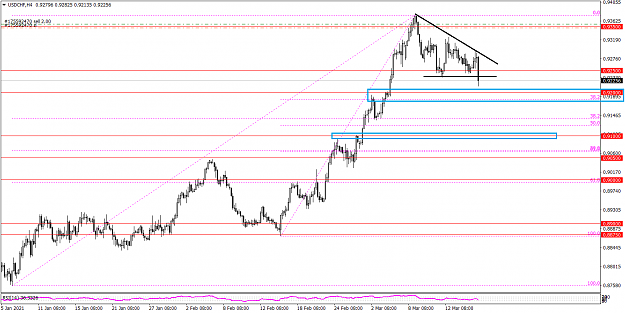
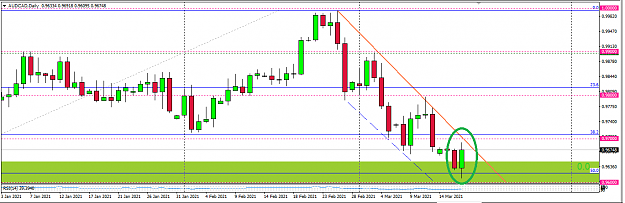
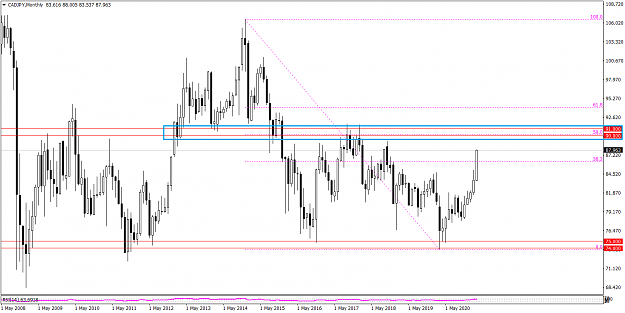
USDCHF 0.9350 short trade. Levels to watch. The overall pattern on weekly chart looks like a broadening formation with long term bullish implication. UCHF might be heading to parity eventually, although it will not be a straight line. {image}
Ignored
USDCHF 0.9350 short trade update. Levels to watch.
{quote} Cheers C You are right I have been trying to find a balance between trend following and counter trend setups. I noticed we were doing a lot of counter trend setups which was not very efficient. Also, I've been incorporating the bigger picture (based on daily and weekly chart) into my trades. The example was EU short trade that I managed to keep longer than usual. I think I did +25 trades last week. A few of them ended up at b/e, but the winners were mostly +100 pips. The only mistake was closing GU 1.3450 long trade prematurely (+95 instead...
Ignored
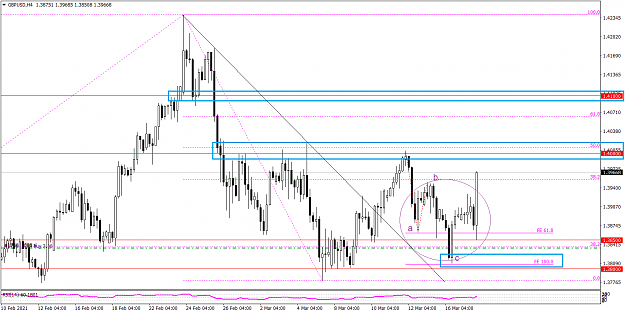
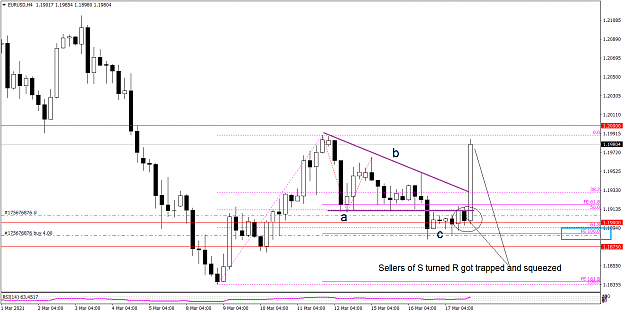
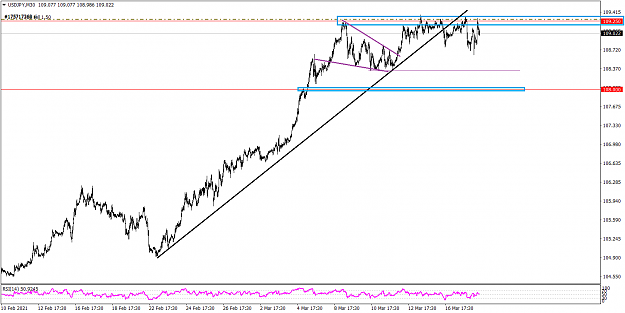
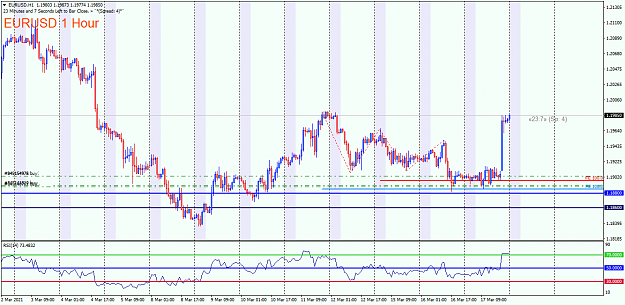
I explained this triangle trap and squeeze pattern before. But I think it is underappreciated by many so I elaborate once again. You can check out my previous post to see the similarities between these patterns. So basically, you can spot this pattern when you have an abc correction with a triangle as wave b. You can trade this pattern when the wave c is completed (you can also locate the end of wave c using Fib expansion) as it will lead to a very impulsive upside move.
P.S. I have to mention that I was once one of those sellers, but I learned my lesson. So that's why I keep sharing this stuff here. Hope someone find them helpful.
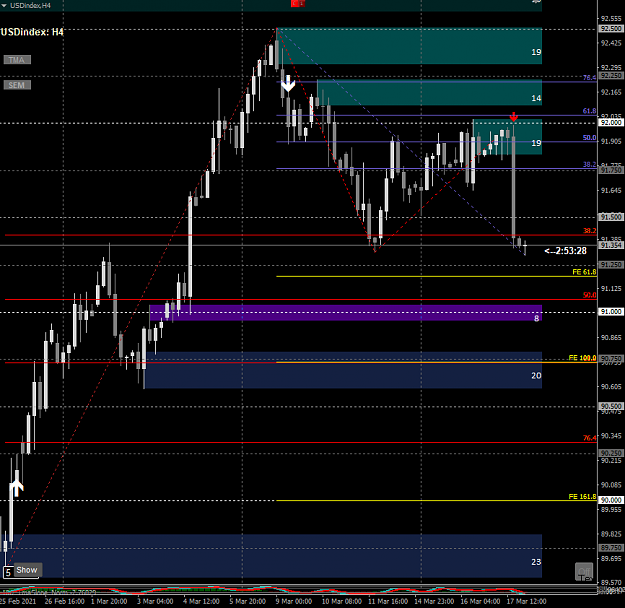
Soory to say but $ is turned in T P - rate hiking not gona be until 2024 {image}
Ignored
You can never be certain. Because they might be forced to do that. The Fed usually follows what the bond market has priced in. There are many historical examples. https://socionomics.net/2019/01/the-...ket-yet-again/
{quote} I explained this triangle trap and squeeze pattern before. But I think it is underappreciated by many so I elaborate once again. You can check out my previous post to see the similarities between these patterns. So basically, you can spot this pattern when you have an abc correction with a triangle as wave b. You can trade this pattern when the wave c is completed (you can also locate the end of wave c using Fib expansion) as it will lead to a very impulsive upside move. P.S. I have to mention that I was once one of those sellers, but I...
Ignored
Hi Shahab8b,
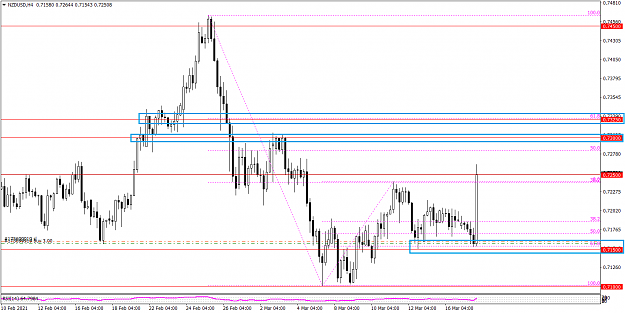
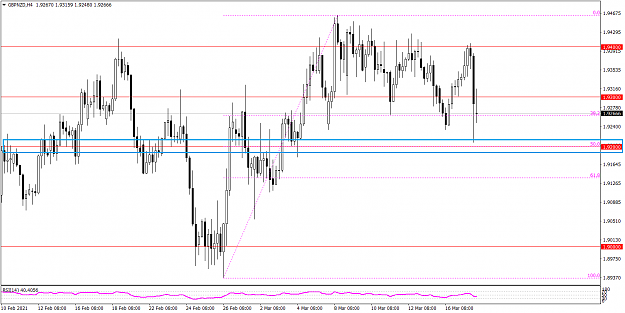
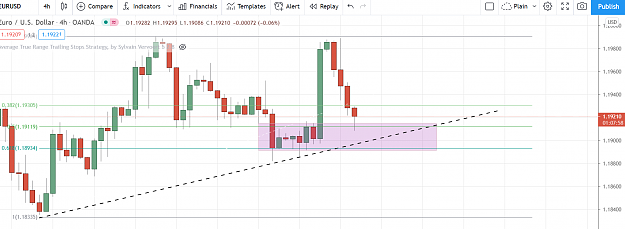
I have been patience to watching the price play on around FE100 pullback area of EU and i got the right entry on here
Your advice is good and very useful for all to see the future to make us better understand in this trade, and prepare when is the right time to make decisions in this currency trading market, I understand all the advice and useful tips that you give, thank you, best regards ..
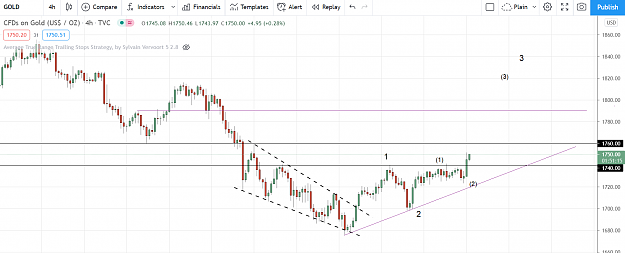
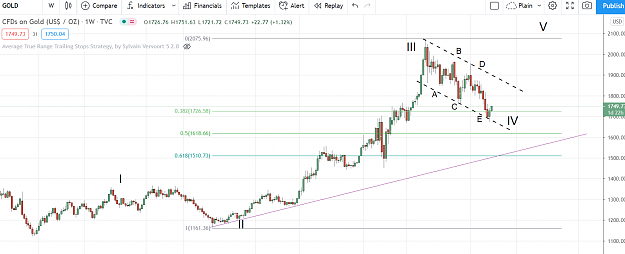
Gold, I'm still tracking this as an expanding triangle, with the next major leg going higher after completion of the pattern. Let's see if gold stabilizes somewhere between 1700 and 1600. {image}
{quote} Hi Al, I think Gold is forming an expanding triangle (or more specifically a descending broadening wedge according to the encyclopedia of chart pattern by Thomas Bulkowski). I noticed a similar pattern on Gold back in 2008-2009. As you can see it may continue for a long period of time. I think 1750/1700 may provide good long opportunities for long term investment. {image} {image}
{quote} Hi Shahab8b, I have been patience to watching the price play on around FE100 pullback area of EU and i got the right entry on here Your advice is good and very useful for all to see the future to make us better understand in this trade, and prepare when is the right time to make decisions in this currency trading market, I understand all the advice and useful tips that you give, thank you, best regards .. {image}
Ignored
Thank you for your kind words mrhb30jr. Also well done on those nice trades!
{quote} I explained this triangle trap and squeeze pattern before. But I think it is underappreciated by many so I elaborate once again. You can check out my previous post to see the similarities between these patterns. So basically, you can spot this pattern when you have an abc correction with a triangle as wave b. You can trade this pattern when the wave c is completed (you can also locate the end of wave c using Fib expansion) as it will lead to a very impulsive upside move. P.S. I have to mention that I was once one of those sellers, but I...
Ignored
Great catches
The DXY also had a the 92.00 confluence level of SD and 50-61.8% we'd been monitoring it all week.
Those FE 100 expansions are offering accurate targets. 91/90.75 looks interesting.
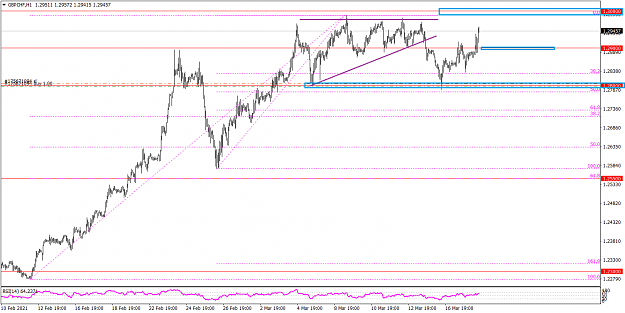
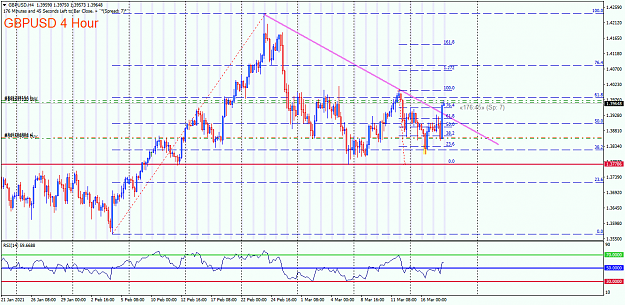
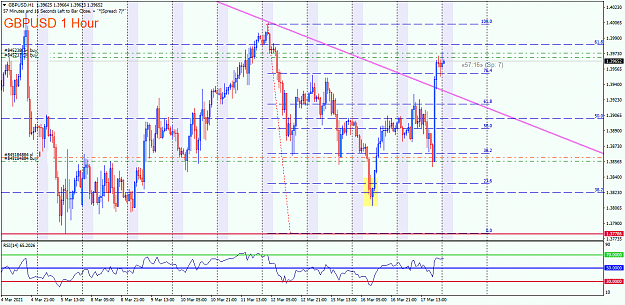
{quote} GBPCHF 1.28 long trade. Levels to watch. {image}
Ignored
GBPCHF 1.28 long trade update. 1.29 level short setup highlighted on the previous chart provided 50 pips or so had anyone taken it but I opted to keep the long trade. Levels to watch.