• Home
  • Forums
  • Trades
  • News
  • Calendar
  • Market
  • Brokers
  • Login
  • Join
  • User/Email: Password:
  • 11:19pm
Menu
  • Forums
  • Trades
  • News
  • Calendar
  • Market
  • Brokers
  • Login
  • Join
  • 11:19pm
Sister Sites
  • Metals Mine
  • Energy EXCH
  • Crypto Craft

Options

Bookmark Thread

First Page First Unread Last Page Last Post

Print Thread

Similar Threads

What is order flow trading? 93 replies

How to flow with the order flow? 26 replies

Order flow trading thread 166 replies

Domino's Price and order flow trading 1,400 replies

Order Flow Trading with ICCE Channels 3 replies

  • Commercial Content
  • /
  • Reply to Thread
  • Subscribe
  • 7,488
Attachments: Trading Institutional Order Flow
Exit Attachments
Tags: Trading Institutional Order Flow
Cancel

Trading Institutional Order Flow

  • Last Post
  •  
  • 1 460461Page 462463464 507
  • 1 Page 462 507
  •  
  • Post #9,221
  • Quote
  • Mar 3, 2021 11:48pm Mar 3, 2021 11:48pm
  •  Varma123
  • | Joined Dec 2020 | Status: Member | 64 Posts
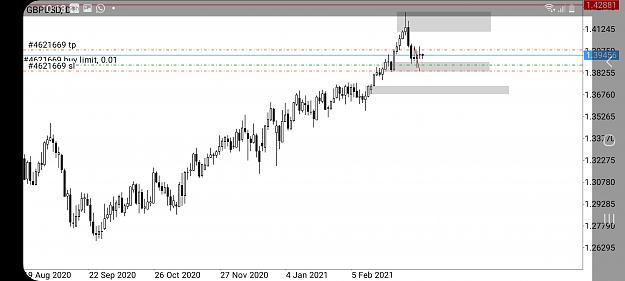
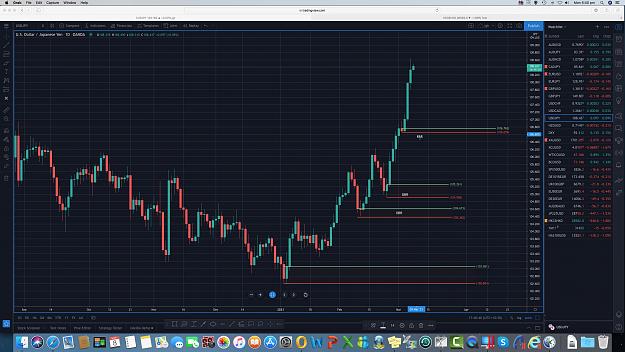
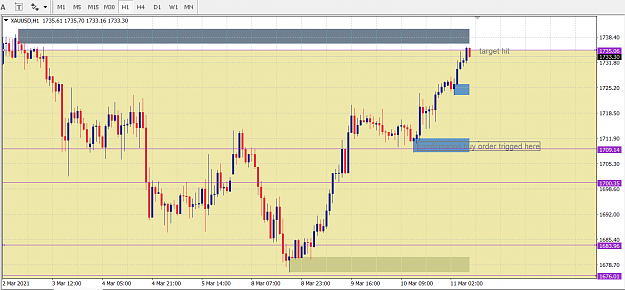
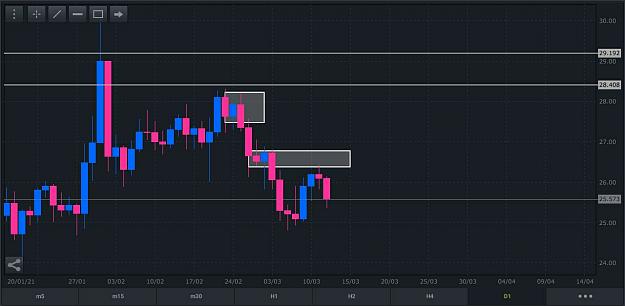
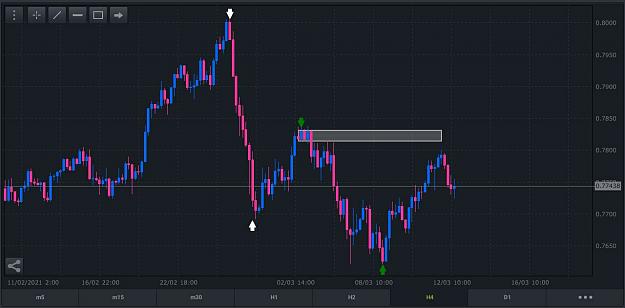
Looking for buys in GBPUSD:
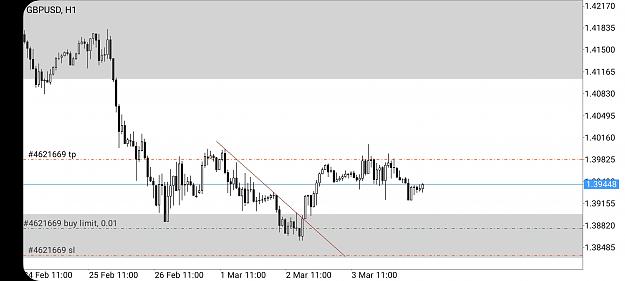
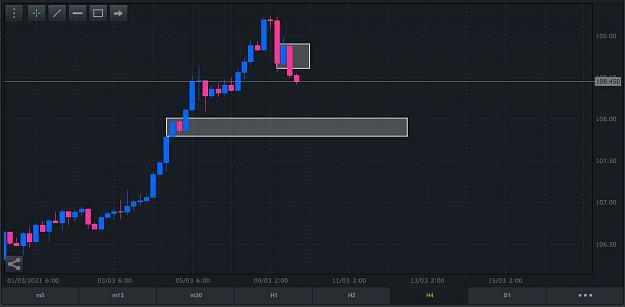
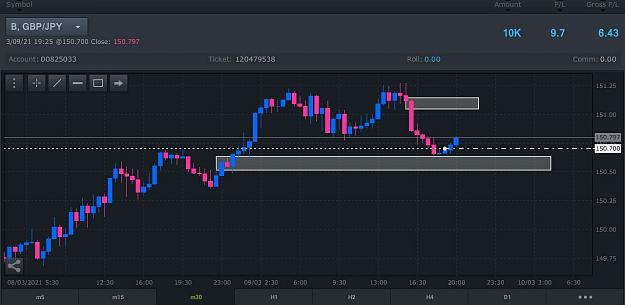
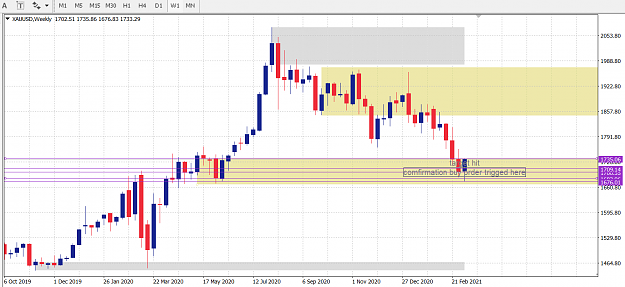
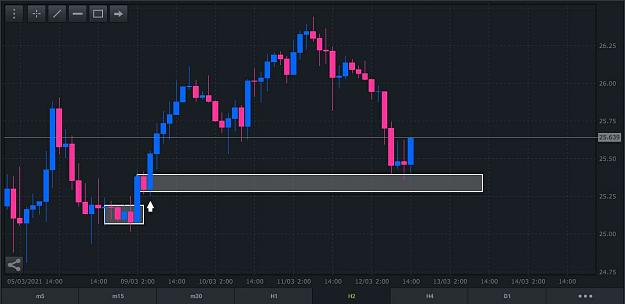
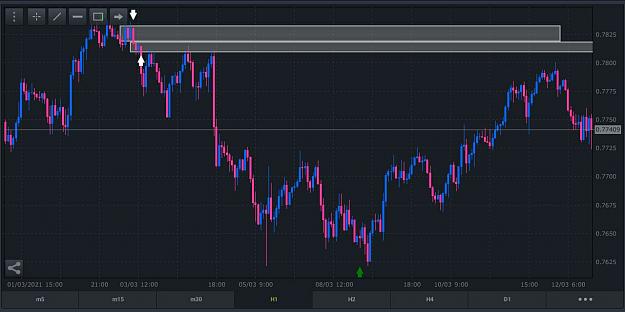
1 . Daily upward ML broken
2. Trend is sideways
3. Price in daily demand
4. H1 ML broken
5. Found DBR demand zone which is responsible for the ML break


Comments are welcomed!!!
Attached Image(s) (click to enlarge)
Click to Enlarge

Name: Screenshot_20210304-101302_MetaTrader 4.jpg
Size: 475 KB
Click to Enlarge

Name: Screenshot_20210304-101242_MetaTrader 4.jpg
Size: 729 KB
 
 
  • Post #9,222
  • Quote
  • Mar 5, 2021 5:54am Mar 5, 2021 5:54am
  •  Varma123
  • | Joined Dec 2020 | Status: Member | 64 Posts
Hai AKT and SAD traders,
Just came up with doubt, as a SAD trader we know that if we remove a zone and inability to draw ML we cal it sideways..here my doubt is what if the zone is formed with no stay away candle and it removed that zone will we still call it as a zone removal or will we consider only the zone with stay away candle and removal?. Would appreciate if you take time to explain this. Thank you.
 
 
  • Post #9,223
  • Quote
  • Edited 11:13am Mar 6, 2021 11:01am | Edited 11:13am
  •  Paulscaff1
  • Joined Feb 2021 | Status: Member | 637 Posts
Quoting Varma123
Disliked
Hai AKT and SAD traders, Just came up with doubt, as a SAD trader we know that if we remove a zone and inability to draw ML we cal it sideways..here my doubt is what if the zone is formed with no stay away candle and it removed that zone will we still call it as a zone removal or will we consider only the zone with stay away candle and removal?. Would appreciate if you take time to explain this. Thank you.
Ignored
Hi Varma

By "stay away candle" , do you mean "at least one full ohlc candle consolidating away after the imbalance?

My understanding is that yes, the zone would be removed. But you need at least one full candle consolidating/staying away to class it as a "tradeable" zone
 
 
  • Post #9,224
  • Quote
  • Mar 7, 2021 12:52am Mar 7, 2021 12:52am
  •  Varma123
  • | Joined Dec 2020 | Status: Member | 64 Posts
Quoting Paulscaff1
Disliked
{quote} Hi Varma By "stay away candle" , do you mean "at least one full ohlc candle consolidating away after the imbalance? My understanding is that yes, the zone would be removed. But you need at least one full candle consolidating/staying away to class it as a "tradeable" zone
Ignored
Yeah Paulscaff, you got me right. Thank you.
 
 
  • Post #9,225
  • Quote
  • Mar 7, 2021 12:55am Mar 7, 2021 12:55am
  •  Varma123
  • | Joined Dec 2020 | Status: Member | 64 Posts
Hello Traders,
Let me know which DZ marking is right ?
Attached Image(s) (click to enlarge)
Click to Enlarge

Name: Screenshot_20210307-111954_MetaTrader 4.jpg
Size: 389 KB
Click to Enlarge

Name: Screenshot_20210307-111937_MetaTrader 4.jpg
Size: 377 KB
 
 
  • Post #9,226
  • Quote
  • Mar 8, 2021 2:12am Mar 8, 2021 2:12am
  •  jgk
  • | Joined Mar 2011 | Status: Member | 58 Posts
Hi Varma,
The second chart is the correct RBR at the top you also have two DBR at the momentum line begin and end

Attached Image (click to enlarge)
Click to Enlarge

Name: USDJPYdaily.jpeg
Size: 718 KB


Regards
JGK
 
 
  • Post #9,227
  • Quote
  • Mar 9, 2021 3:06am Mar 9, 2021 3:06am
  •  jgk
  • | Joined Mar 2011 | Status: Member | 58 Posts
Hi Varma you now have daily going into supply zone so what are you now to do given this event ?
Attached Image (click to enlarge)
Click to Enlarge

Name: USDJPYdaily2.jpeg
Size: 683 KB


Regards JGK
 
 
  • Post #9,228
  • Quote
  • Mar 9, 2021 4:47am Mar 9, 2021 4:47am
  •  Varma123
  • | Joined Dec 2020 | Status: Member | 64 Posts
Quoting jgk
Disliked
Hi Varma you now have daily going into supply zone so what are you now to do given this event ? {image} Regards JGK
Ignored
Definitely, not looking for buys in daily supply!!!
 
 
  • Post #9,229
  • Quote
  • Mar 9, 2021 4:57am Mar 9, 2021 4:57am
  •  jgk
  • | Joined Mar 2011 | Status: Member | 58 Posts
Great answer Varma so at this point you are looking for opportunities to maybe sell but only on confirmation trade it would also be ok to stand aside and wait
for the price to come back to the RBR you have currently on the daily and perhaps what for a long entry.So it just depends on what your model will let you trade .
So if you go short you would be counter trend trading hence the confirmation trade for a short trade is what i would be looking for to take it short.Also at the RBR i would also look for confirmation trade as this has run up a long way. many ways to approach from both the long side and the short side again it's what your trade plan let's you do.

this is just my way i would do it according to my trade plan.

Regards
JGK
 
1
  • Post #9,230
  • Quote
  • Mar 9, 2021 3:08pm Mar 9, 2021 3:08pm
  •  joe123
  • Joined Nov 2014 | Status: Simple Trade | 428 Posts
Quoting jgk
Disliked
Hi Varma, The second chart is the correct RBR at the top you also have two DBR at the momentum line begin and end {image} Regards JGK
Ignored
I don't think will get down there just yet. I would expect another move up from the 4h demand rather then the daily that you posted.

Will have to consume first the initial demand on 4h. I have a buy order sitting there.
Attached Image (click to enlarge)
Click to Enlarge

Name: Screenshot_2021-03-09-20-01-08-816.jpeg
Size: 69 KB
Indicators only Indicate, Price action dictates.
 
 
  • Post #9,231
  • Quote
  • Mar 9, 2021 3:33pm Mar 9, 2021 3:33pm
  •  joe123
  • Joined Nov 2014 | Status: Simple Trade | 428 Posts
I had a buy order that got triggered for pound/yen at demand. Am expecting a new high to form. 5 min there's a supply sitting that it has to get through first.
Attached Image (click to enlarge)
Click to Enlarge

Name: Screenshot_2021-03-09-20-25-06-570.jpeg
Size: 103 KB
Indicators only Indicate, Price action dictates.
 
 
  • Post #9,232
  • Quote
  • Mar 9, 2021 9:24pm Mar 9, 2021 9:24pm
  •  godunk99
  • | Joined Oct 2014 | Status: Member | 44 Posts
back the the place where i actually belong...
hi guys brothers and friend of SnD met. i've been away for few years travelling the world(world of techniques) and m so glad m back to where i should belong. i was from Moreno's thread and recently found this Akt's..... this will be great as m a short term trader, Daily is my curve. i will need to get back to the SnD track. revising all the mythologies. would love to have ur guidance in this and thanks in advance. would love to have a great years with you all here in this thread..cheers
 
 
  • Post #9,233
  • Quote
  • Mar 10, 2021 8:44pm Mar 10, 2021 8:44pm
  •  joe123
  • Joined Nov 2014 | Status: Simple Trade | 428 Posts
So looking at silver, this area would be a nice place to look for a buy. Lower demand is at 25.40.

What's your thoughts?
Attached Image (click to enlarge)
Click to Enlarge

Name: Screenshot_2021-03-11-01-38-59-986.jpeg
Size: 95 KB
Indicators only Indicate, Price action dictates.
 
 
  • Post #9,234
  • Quote
  • Mar 11, 2021 1:34am Mar 11, 2021 1:34am
  •  Collotennis
  • | Joined Feb 2021 | Status: Member | 23 Posts
XAU/USD, confirmation long 1hr trade hit my target. Inside daily demand and weekly demand with an engulfing daily candle.
Attached Image (click to enlarge)
Click to Enlarge

Name: aususd daily.PNG
Size: 56 KB

Attached Image (click to enlarge)
Click to Enlarge

Name: xauusd.PNG
Size: 67 KB

Attached Image (click to enlarge)
Click to Enlarge

Name: weekly.PNG
Size: 58 KB
 
 
  • Post #9,235
  • Quote
  • Mar 11, 2021 4:11am Mar 11, 2021 4:11am
  •  joe123
  • Joined Nov 2014 | Status: Simple Trade | 428 Posts
Went for a buy yesterday in eurusd before sleep and hit my limit during the night.

Closed out GBPJPY
Attached Image (click to enlarge)
Click to Enlarge

Name: Screenshot_2021-03-11-08-57-45-336.jpeg
Size: 81 KB
Indicators only Indicate, Price action dictates.
 
 
  • Post #9,236
  • Quote
  • Mar 12, 2021 9:37am Mar 12, 2021 9:37am
  •  joe123
  • Joined Nov 2014 | Status: Simple Trade | 428 Posts
Quoting joe123
Disliked
So looking at silver, this area would be a nice place to look for a buy. Lower demand is at 25.40. What's your thoughts? {image}
Ignored
So my silver long at demand wasn't triggered as it missed my target. It created a supply on the way down so decided to short. Closed half just now, as it's reaching something of a demand at 25.40 ish
Attached Image (click to enlarge)
Click to Enlarge

Name: Screenshot_2021-03-12-14-28-42-550.jpeg
Size: 101 KB
Indicators only Indicate, Price action dictates.
 
 
  • Post #9,237
  • Quote
  • Mar 12, 2021 10:13am Mar 12, 2021 10:13am
  •  joe123
  • Joined Nov 2014 | Status: Simple Trade | 428 Posts
Looking at silver, daily supply is clearly visible

Attached Image (click to enlarge)
Click to Enlarge

Name: Screenshot_2021-03-12-14-48-26-179.jpeg
Size: 80 KB

although I got triggered a long at 25.40 with 2 supply's coming in a little higher as my first target to close. As normal will leave the rest to run at break even

Attached Image (click to enlarge)
Click to Enlarge

Name: Screenshot_2021-03-12-14-51-13-283.jpeg
Size: 86 KB

Silver has had some very good set ups to trade. Easy to read.
Indicators only Indicate, Price action dictates.
 
 
  • Post #9,238
  • Quote
  • Mar 12, 2021 10:27am Mar 12, 2021 10:27am
  •  joe123
  • Joined Nov 2014 | Status: Simple Trade | 428 Posts
Quoting Collotennis
Disliked
XAU/USD, confirmation long 1hr trade hit my target. Inside daily demand and weekly demand with an engulfing daily candle. {image} {image} {image}
Ignored
Hey collotennis, gold hasn't really been acting great. On daily there was a supply cap in price I was looking at, but lower time frame (LTF) it was struggling to give me a supply zone to short it with. Reason I stayed away from it. It went up to know where on LTF.

Hope you did well.
Attached Image (click to enlarge)
Click to Enlarge

Name: Screenshot_2021-03-12-15-21-20-059.jpeg
Size: 52 KB
Indicators only Indicate, Price action dictates.
 
 
  • Post #9,239
  • Quote
  • Mar 12, 2021 11:38am Mar 12, 2021 11:38am
  •  joe123
  • Joined Nov 2014 | Status: Simple Trade | 428 Posts
Quoting joe123
Disliked
{quote} Hey collotennis, gold hasn't really been acting great. On daily there was a supply cap in price I was looking at, but lower time frame (LTF) it was struggling to give me a supply zone to short it with. Reason I stayed away from it. It went up to know where on LTF. Hope you did well. {image}
Ignored

So what do I do in order to determine where price might move from and to where. This is AUD/USD.

1. I look at a higher time frame (HTF) chart and figure out where the tops and bottoms are. This is a daily chart. The white arrows is on move down while the green arrow is another move down. it's no point marking a horizontal line at these moves just like that, as it won't tell us where a supply zone is.

2. We need to look into (first) the moves of the green arrows to find a supply zone somewhere in this move and (second) if not, we then need to look in to the move down where the white arrows is.

Attached Image (click to enlarge)
Click to Enlarge

Name: Screenshot_2021-03-12-15-51-05-730.jpeg
Size: 74 KB

3. So we go into a Lower time frame (LTF) such as a 4 hour to find, at extremes of price, a cap in price such as this, or a flag, (can you find a flag in move down within the green arrows? There is one, can you see it?) where prices will find a pause in direction and move lower. To find the exact level where there has been supply in the passed, we need to go into an even LTF such as the 1 hour
Attached Image (click to enlarge)
Click to Enlarge

Name: Screenshot_2021-03-12-15-50-39-042.jpeg
Size: 87 KB


4.the exact levels of the supply are shown very clearly on the 1 hour chart. This is where price is more likely to turn. There is a supply zone where price tested and a higher supply zone stacked on top of it. Taking into account that we are in a uptrend on HTF. I find many times that price reaches close to the level but doesnt touch the level while consuming that level. This normally happens in a counter trend move such as this.
Attached Image (click to enlarge)
Click to Enlarge

Name: Screenshot_2021-03-12-15-46-41-760.jpeg
Size: 107 KB


This is how I analyze my viewing of a market. If you can do it to, you'll start seeing how the market breaths. Best to take 2 or 3 markets and patiently try and track it, if it gives you setups that are clear.

Till later
Indicators only Indicate, Price action dictates.
 
 
  • Post #9,240
  • Quote
  • Mar 13, 2021 4:44am Mar 13, 2021 4:44am
  •  Akt
  • | Commercial Member | Joined Jan 2016 | 2,643 Posts
Hello everyone.
I hope you are all well and safe.

It has been a while and I do apologise for my absence. I was unfortunate enough to have been infected by Corona virus and all i can say is that it is not the flu
I am grateful to have survived it but it has taken this long for me to feel any where near able enough to join you all in here.

Thanks to all of you who have been sharing your ideas and helping one another here. Much appreciated.

I look forward to resuming sharing here with you all.

best wishes
Attached Image (click to enlarge)
Click to Enlarge

Name: AAPL.PNG
Size: 278 KB
Be careful what you think because your thoughts run your life..Solomon
 
1
  • Commercial Content
  • /
  • Trading Institutional Order Flow
  • Reply to Thread
    • 1 460461Page 462463464 507
    • 1 Page 462 507
0 traders viewing now
  • More
Top of Page
  • Facebook
  • Twitter
About FF
  • Mission
  • Products
  • User Guide
  • Media Kit
  • Blog
  • Contact
FF Products
  • Forums
  • Trades
  • Calendar
  • News
  • Market
  • Brokers
  • Trade Explorer
FF Website
  • Homepage
  • Search
  • Members
  • Report a Bug
Follow FF
  • Facebook
  • Twitter

FF Sister Sites:

  • Metals Mine
  • Energy EXCH
  • Crypto Craft

Forex Factory® is a brand of Fair Economy, Inc.

Terms of Service / ©2023