Hello traders,
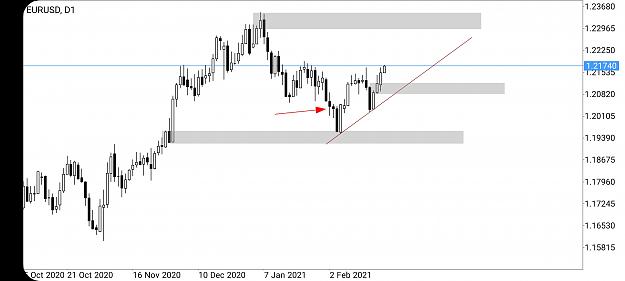
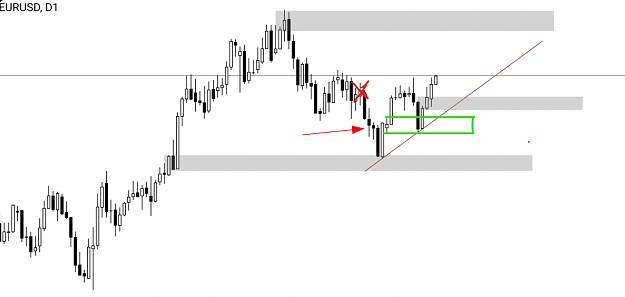
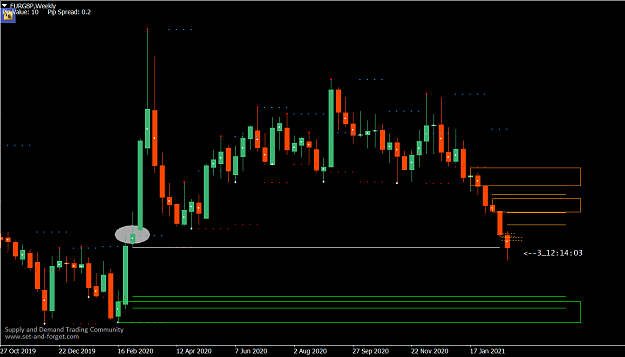
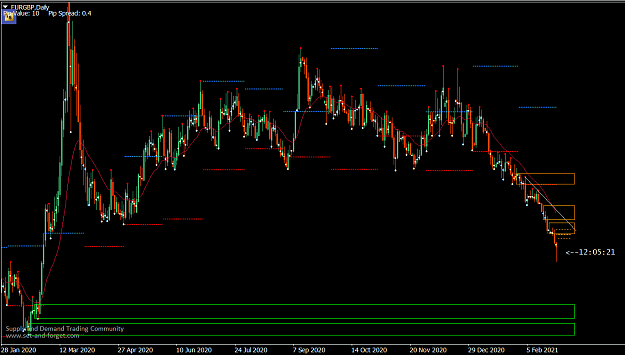
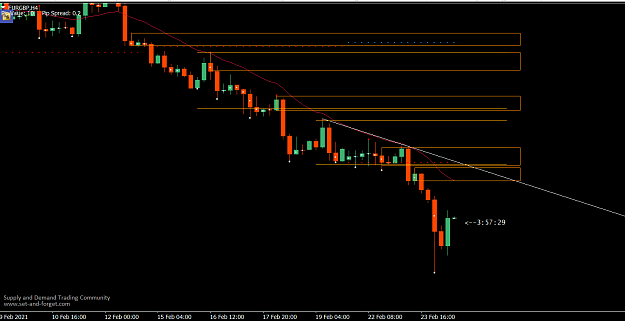
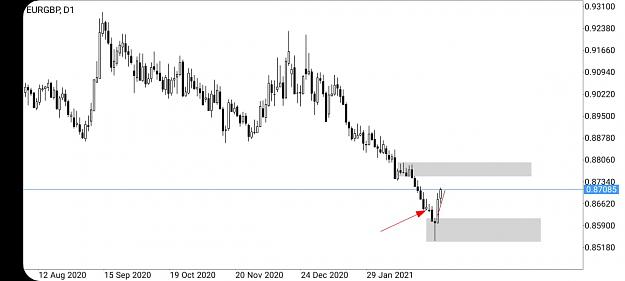
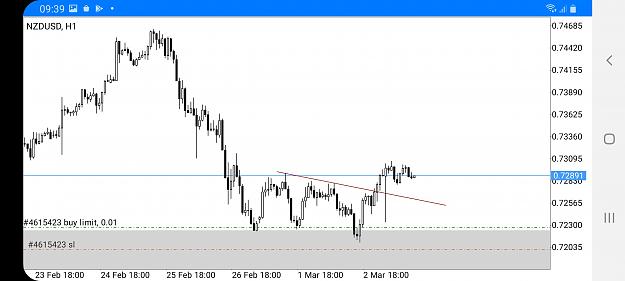
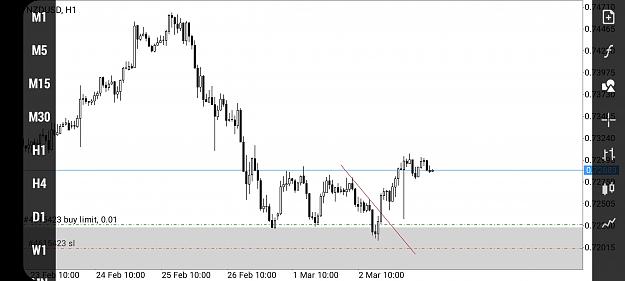
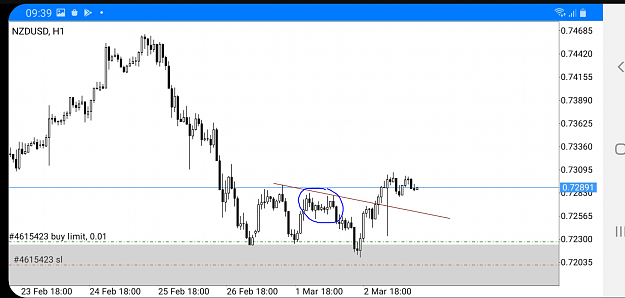
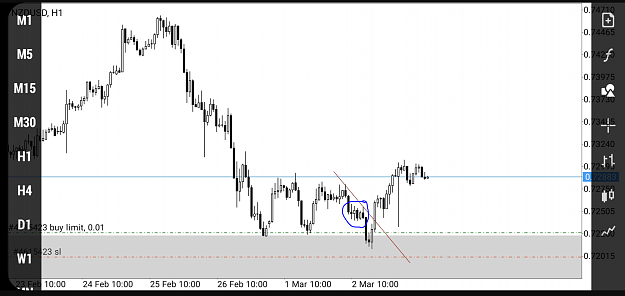
Can someone help me with this..I am confused whether the trend is up or sideways. It removed a supply zone which I pointed in red arrow but it never removed a zone nor it break ML also price never accepted the imbalance. It removed that and also made higher high and we got the ability to draw upward ML. Looking forward for your inputs on this. Thank you.
Can someone help me with this..I am confused whether the trend is up or sideways. It removed a supply zone which I pointed in red arrow but it never removed a zone nor it break ML also price never accepted the imbalance. It removed that and also made higher high and we got the ability to draw upward ML. Looking forward for your inputs on this. Thank you.
Attached Image (click to enlarge)