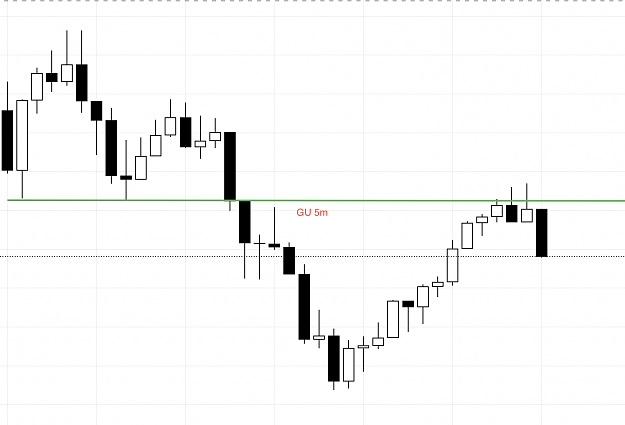
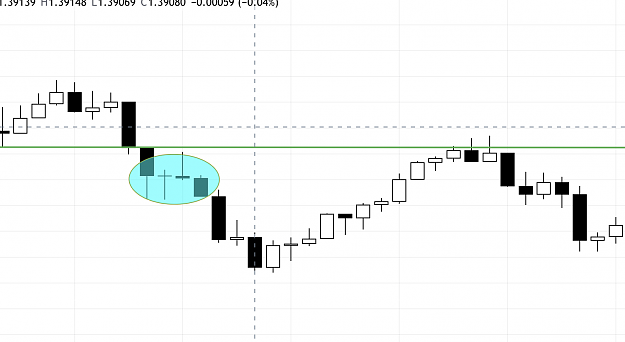
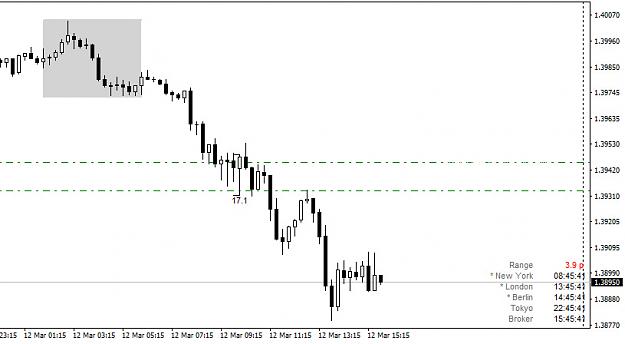
Dislikedhere is a orientation technic i use. on the pink arrow you can see that many longtraders are trapped, because the red candle was brutal like a gap. you can see it because it never revisited the low of the blue bar (blue arrow). therefore this level up to RN 1.40 is a strong resistance zone and selling area. {image}Ignored
I always see these areas looking to the left and depending on how far i look left i would see plenty of them. I then always ask my self what is that of importance to know for the moment i want to enter the trade and isn't it much more important of what i do then.
Support and resistance for example. So you would never buy the market when there is resistance left and you don't have a lot of blank space above you where price never traveled before. Never sell the market where there is support left and you have free room to the south.
I don't know what to think of "trapped" traders. Some people have the idea to buy the market, some people have the idea to sell the market. If there are more sellers price will likely move south right? So trapped is market manipulation? The banks and brokers and the bad guys hunting the stop losses of the small lot positioned retail traders? Even if that is what happens i would have no idea how to protect from that instead of not trading at all.
Looking to the left finding reasons for why not taking a trade you will always find some it is just a matter of how deep/far/detailed you then search/look for.
If you mean to use this spotted area of resistance to enter a trade as a setup it self, forget my words. So you would then go short there as soon as price revisited this area.
1