• Home
  • Forums
  • Trades
  • News
  • Calendar
  • Market
  • Brokers
  • Login
  • Join
  • User/Email: Password:
  • 3:34pm
Menu
  • Forums
  • Trades
  • News
  • Calendar
  • Market
  • Brokers
  • Login
  • Join
  • 3:34pm
Sister Sites
  • Metals Mine
  • Energy EXCH
  • Crypto Craft

Options

Bookmark Thread

First Page First Unread Last Page Last Post

Printable Version

Similar Threads

TOP 100 best Expert Advisors: post good EAs here 205 replies

Top 100 best Trading Systems: post good Trading Systems here 37 replies

TOP 100 best edges on forex charts: post good edges here 115 replies

TOP 100 best things to-do in a Skype group: post ideas here 2 replies

Post Your Best EAs Here 23 replies

  • Platform Tech
  • /
  • Reply to Thread
  • Subscribe
  • 424
Attachments: TOP 100 best indicators: post good indicators here
Exit Attachments

TOP 100 best indicators: post good indicators here

  • Last Post
  •  
  • 1 1718192021 Page 22
  • 1 192021 Page 22
  •  
  • Post #421
  • Quote
  • Aug 18, 2020 5:08am Aug 18, 2020 5:08am
  •  Kmw
  • Joined Nov 2011 | Status: Member | 552 Posts
Quoting lengendff
Disliked
Can point me to an indicator like this? {image}
Ignored
Looks similar to trade report
Attached File
File Type: mq4 TradeReport_compact.mq4   53 KB | 342 downloads
The glory of a mans life belongs to the gardener
  • Post #422
  • Quote
  • Aug 18, 2020 2:04pm Aug 18, 2020 2:04pm
  •  osaze
  • | Joined Sep 2007 | Status: TradazCorp | 42 Posts
Quoting Yashir
Disliked
Hi All. Thanks for the nice thread. Anyone have the Powered Trend Signal Arrow Indicator (Non-Repainting) one in ex4 format. I need it. Thanks in advance. {image}
Ignored
It repaints badly
Everything is bare:thinking: Making the best out of the pips
  • Post #423
  • Quote
  • Nov 2, 2020 2:07pm Nov 2, 2020 2:07pm
  •  RoninTheory
  • Joined Apr 2020 | Status: price is just going from a to b | 475 Posts | Invisible
Quoting Guadeloupe
Disliked
hi the spectrometr did a lot of experiment for the 15 minutes scalping so did change the setup 48 then used only colour 1 and 2 that all {image}
Ignored
sorry to bother you where is that volatility indicator from?
  • Post #424
  • Quote
  • Nov 2, 2020 5:34pm Nov 2, 2020 5:34pm
  •  RoninTheory
  • Joined Apr 2020 | Status: price is just going from a to b | 475 Posts | Invisible
Quoting mntiwana
Disliked
{quote} Here is that one "Tarzan" it is actually rsi with ma applied on,along with Ob/Os levels mtf and alerts package included {image} {file}
Ignored
sir sorry to pest do you have this mtf xo in heatmap version i have hunted high and low some one made sudjestion on f station however i never see post also i can only find one that looks like wonkey ocilator yours is better if i may find

many thanks for your time
  • Post #425
  • Quote
  • Nov 2, 2020 10:19pm Nov 2, 2020 10:19pm
  •  mntiwana
  • Joined Mar 2013 | Status: Member | 1,691 Posts
Quoting RoninTheory
Disliked
{quote} sir sorry to pest do you have this mtf xo in heatmap version i have hunted high and low some one made sudjestion on f station however i never see post also i can only find one that looks like wonkey ocilator yours is better if i may find many thanks for your time
Ignored
Not clear enough to me what you are trying to ask
Indicator is just a supportive tool-Use it only if it can benefit you
1
  • Post #426
  • Quote
  • Nov 3, 2020 2:31am Nov 3, 2020 2:31am
  •  RoninTheory
  • Joined Apr 2020 | Status: price is just going from a to b | 475 Posts | Invisible
Quoting mntiwana
Disliked
{quote} Not clear enough to me what you are trying to ask
Ignored
its okay i find 4 time xo

sorry to bother you thankyou for your time
  • Post #427
  • Quote
  • Nov 7, 2020 3:04pm Nov 7, 2020 3:04pm
  •  ntk
  • | Joined Dec 2018 | Status: Member | 340 Posts
Does anyone recognise the indicator in this picture please sahre the source if possible
Attached Image (click to enlarge)
Click to Enlarge

Name: cycle indicator pic.jpg.png
Size: 115 KB
  • Post #428
  • Quote
  • Nov 8, 2020 1:35am Nov 8, 2020 1:35am
  •  hasib
  • Joined Jan 2013 | Status: Mr. Chartist | 1,655 Posts
Hello all
Hope you all are doing well. I trying to improve my systematic trading. Can you suggest an indicator that will identify the sideway market?
I know that indicator will not be that accurate. If an indicator identifies the sideway market some of the time that will be ok too.
I just want to filter the dead choppy market.

Thanks
  • Post #429
  • Quote
  • Nov 8, 2020 6:43am Nov 8, 2020 6:43am
  •  RoninTheory
  • Joined Apr 2020 | Status: price is just going from a to b | 475 Posts | Invisible
Quoting hasib
Disliked
Hello all Hope you all are doing well. I trying to improve my systematic trading. Can you suggest an indicator that will identify the sideway market? I know that indicator will not be that accurate. If an indicator identifies the sideway market some of the time that will be ok too. I just want to filter the dead choppy market. Thanks
Ignored

you tried looking at mad dash? and playing round with settings and times of day when to take readings?

also not to go missed multi bar 2 beta

if your looking at finding or avoiding ranging markets strong vs strong and weak vs weak in the realms of common sense should in theory range?

im no expert just my veiw good luck


thankyou for the pain - it made me raise my game
  • Post #430
  • Quote
  • Nov 23, 2020 2:45pm Nov 23, 2020 2:45pm
  •  bmcgowra
  • | Joined Apr 2014 | Status: Member | 270 Posts
Quoting michaellobry
Disliked
{quote} Again, thank you very much for sharing this indicator. This shows the numbers 2, 1.9 .... -1.9, -2. What does this scale represent? And does 2, represent 200% from current candle close to previous candle open over the last 1000 candles? I see the numbers 50/20 20/0 0/20 20/40 40/60 60/80 80/100 100/120 120/140 140/160 180/200 200 and more. Do these numbers represent fibonacci of a swing? Or does it represent the amount of fixed pips or relative percentage? If the latter, I assume that 200 (bottom on chart) is equal to '2' (top right on chart)....
Ignored
Hi Michael, I tried opening this indicator you forwarded, but can't open it. Says the files expired. Could you forward all files in mql4? Some of them are ext4 files.
  • Post #431
  • Quote
  • Nov 24, 2020 5:51pm Nov 24, 2020 5:51pm
  •  wansiman
  • | Joined Jul 2010 | Status: Member | 103 Posts
Quoting ntk
Disliked
Does anyone recognise the indicator in this picture please sahre the source if possible {image}
Ignored
Try Google search "total useless indicator"
2
  • Post #432
  • Quote
  • Nov 25, 2020 2:23am Nov 25, 2020 2:23am
  •  ntk
  • | Joined Dec 2018 | Status: Member | 340 Posts
Quoting wansiman
Disliked
{quote} Try Google search "total useless indicator"
Ignored
this indicators is printed in a old presentation of DOW theory in TA. So I guess you are on ly joking
  • Post #433
  • Quote
  • Jan 16, 2021 3:13pm Jan 16, 2021 3:13pm
  •  hasib
  • Joined Jan 2013 | Status: Mr. Chartist | 1,655 Posts
Quoting michaellobry
Disliked
{quote} Thank you! {quote} {quote} I direct you to the programmer and FS site. The features are: Automatic money management with an automatic risk-reward ratio. Multi-time frame Multi-currency waves display with an alarm. You can also change the chart time frame and currency directly from the panel. Mini charts with Candles, MAs, Fractals, ATR, Envelopes, PSAR, Bollinger bands. Mini charts oscillators with multi-time frames divergence and signaling and four optional oscillators to choose from. Stochastic, RSI, MACD or AO. Automatic correlations...
Ignored
Good ind. thanks for that, Does the Indicator consider all the standard EW Theory principles.
1
  • Post #434
  • Quote
  • Feb 13, 2021 10:35am Feb 13, 2021 10:35am
  •  hhloverhh
  • | Joined Feb 2018 | Status: Member | 137 Posts
Quoting JensItzig
Disliked
Ok. I throw this one in the ring. It determines the current trend on several timeframes for overview and shows it as well on the current timeframe. As you can see you get a nice overview through the timeframes of an instrument. Trend determination is done by pure price action (no guessing via MA, ADX ATR, Supertrend or other stuff - it works like your brain would work looking out for trends). {image} {file}
Ignored
This indicator expired, have you a new one? Or can say us where you find this Indicator?

Thx in advance
  • Post #435
  • Quote
  • Feb 13, 2021 2:46pm Feb 13, 2021 2:46pm
  •  Taugo
  • | Joined Jan 2021 | Status: Junior Member | 3 Posts
the best indicator is experience and patience , aligator is fine if you have not better , trade when London opening to close ...thats all..8hours a day is maximum to be
concentrated ...best regards my traders
  • Post #436
  • Quote
  • Feb 13, 2021 4:05pm Feb 13, 2021 4:05pm
  •  Ihlas
  • | Joined Nov 2020 | Status: Weekly Profit: 100% | 77 Posts
Hi!
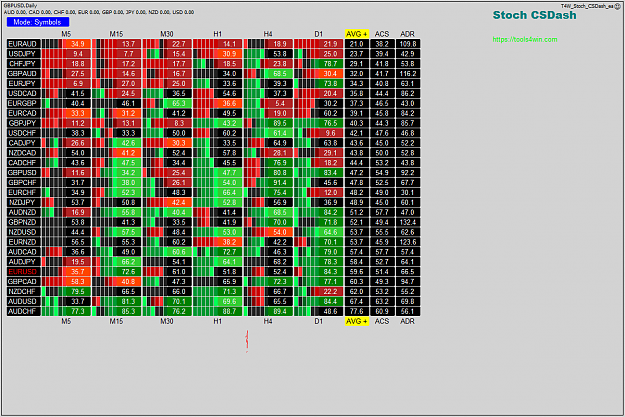
Does someone know if there is ADX dashboard that shows trend power?
Thank you in advance.
Good luck.

Similar:
Attached Image (click to enlarge)
Click to Enlarge

Name: GBPUSDDaily.png
Size: 104 KB
  • Post #437
  • Quote
  • Feb 14, 2021 12:49am Feb 14, 2021 12:49am
  •  LloydOz
  • Joined Oct 2019 | Status: Member | 387 Posts | Online Now
Quoting Ihlas
Disliked
Hi! Does someone know if there is ADX dashboard that shows trend power? Thank you in advance. Good luck. Similar: {image}
Ignored
The Metatrader ADX formula is incorrect.

Dunno why someone hasn't seen fit to custom code it correctly. Beggars belief.

Once that is done, then it may be useful to explore something like a dashboard or whatever.
  • Post #438
  • Quote
  • Feb 14, 2021 4:08am Feb 14, 2021 4:08am
  •  Ihlas
  • | Joined Nov 2020 | Status: Weekly Profit: 100% | 77 Posts
I want to combine ADX dashboard with RSI dashboard. IMO it can be powerful to catch the momentum of trend. Good luck.
Have a good day.
  • Post #439
  • Quote
  • Feb 17, 2021 8:11am Feb 17, 2021 8:11am
  •  fibozone
  • | Joined Nov 2009 | Status: Member | 27 Posts
Quoting JensItzig
Disliked
Ok. I throw this one in the ring. It determines the current trend on several timeframes for overview and shows it as well on the current timeframe. As you can see you get a nice overview through the timeframes of an instrument. Trend determination is done by pure price action (no guessing via MA, ADX ATR, Supertrend or other stuff - it works like your brain would work looking out for trends). {image} {file}
Ignored
Seems Expired
  • Post #440
  • Quote
  • Last Post: Feb 21, 2021 9:47pm Feb 21, 2021 9:47pm
  •  WhiteDigger
  • | Joined Nov 2019 | Status: Member | 6 Posts
Quoting Ihlas
Disliked
Hi! Does someone know if there is ADX dashboard that shows trend power? Thank you in advance. Good luck. Similar: {image}
Ignored
this is only substitute i could find
https://www.forexfactory.com/thread/...-for-all-pairs
  • Platform Tech
  • /
  • TOP 100 best indicators: post good indicators here
  • Reply to Thread
    • 1 1718192021 Page 22
    • 1 192021 Page 22
1 trader viewing now
Top of Page
  • Facebook
  • Twitter
About FF
  • Mission
  • Products
  • User Guide
  • Media Kit
  • Blog
  • Contact
FF Products
  • Forums
  • Trades
  • Calendar
  • News
  • Market
  • Brokers
  • Trade Explorer
FF Website
  • Homepage
  • Search
  • Members
  • Report a Bug
Follow FF
  • Facebook
  • Twitter

FF Sister Sites:

  • Metals Mine
  • Energy EXCH
  • Crypto Craft

Forex Factory® is a brand of Fair Economy, Inc.

Terms of Service / ©2021