• Home
  • Forums
  • Trades
  • News
  • Calendar
  • Market
  • Brokers
  • Login
  • Join
  • User/Email: Password:
  • 1:31pm
Menu
  • Forums
  • Trades
  • News
  • Calendar
  • Market
  • Brokers
  • Login
  • Join
  • 1:31pm
Sister Sites
  • Metals Mine
  • Energy EXCH
  • Crypto Craft

Options

Bookmark Thread

First Page First Unread Last Page Last Post

Printable Version

Similar Threads

How to Blow $200 account using VSA--- 579 replies

VSA Journal 57 replies

VSA-divergence trading 186 replies

VSA broker history change datas 11 replies

  • Interactive Trading
  • /
  • Reply to Thread
  • Subscribe
  • 10,941
Attachments: vsa with Malcolm
Exit Attachments

vsa with Malcolm

  • Last Post
  •  
  • 1 16821683168416851686 Page 1687
  • 1 1686 Page 1687
  •  
  • Post #33,721
  • Quote
  • Feb 12, 2021 3:50am Feb 12, 2021 3:50am
  •  Cyberforex
  • | Joined May 2020 | Status: Member | 145 Posts
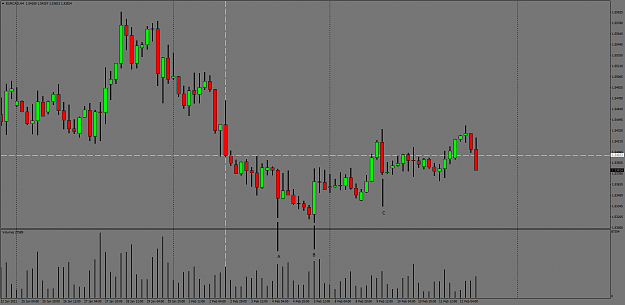
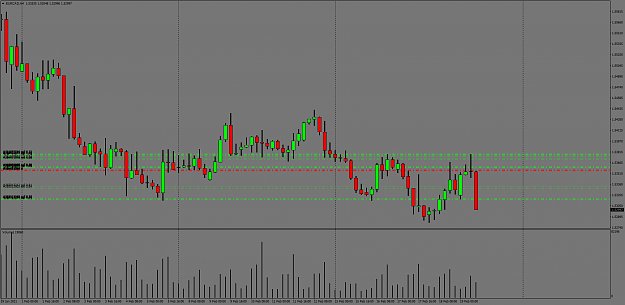
My short entry for GBPUSD .... this is the last time i will inform here about my entry ... if someone is interested then just subscribe my thread because i dont want make a double posting ... sorry i'm a bit lazy ....

https://www.forexfactory.com/thread/...6#post13406296
  • Post #33,722
  • Quote
  • Edited at 12:27pm Feb 12, 2021 12:15pm | Edited at 12:27pm
  •  Anotan
  • Joined Jan 2015 | Status: Member | 640 Posts
Quoting Cyberforex
Disliked
{quote} max out margin, its a risky position....
Ignored
Lets look at this from a different perspective.

You have Trader A who risks 10% on a trade and take 1 trade per week.

You have Trade B who risks 1% per trade but take 5-10 trades per day.

Who is risking more money? Trader A, if he loses his one trade is out 10% for the week, Trader B who is risks potentially 5-10% per day, worst case scenario he could potentially lose 50% in a week.

On average I take 1-2 trades a week sometimes I do take more and sometimes I don't take trades for weeks at a time. When I do max out my margin I always use a stop loss which on average my losses tend to be between 8-15%. I did get caught last year and lost something like 25 or 26%. That may seem like a lot, but the frequency in which I trade is a lot lower than most I think.
2
  • Post #33,723
  • Quote
  • Feb 12, 2021 12:26pm Feb 12, 2021 12:26pm
  •  Anotan
  • Joined Jan 2015 | Status: Member | 640 Posts
Quoting titann
Disliked
{quote} Actually, do you know what makes him open so much "sell" position in terms of VSA? I cant think of strong fundamentals progress that motivates him to do so....(maybe im wrong as VSA requires huge experience and wide expertise to dissect such judgement.... i wander what malcolm can say about this....) it reminds me of myself in the past.....it is just too much of a position executed ..... when i cant fight with those fundamental guys, and it makes me open too many positions, without proper justification, it just makes the whole scenario mimicking...
Ignored
Its strange that you would ask someone else why i would take a sell.

As far as fundamentals go, I do pay some attention to them but they don't take a front seat to my trading decisions.

In VSA terms, look at Bar A and Bar B, there is buying on the pair but look at Bar C. If the pair was being accumulated with active buying across Bar A and Bar B, why is there such strong selling on Bar C? It doesn't make sense, if the pair was being actively bought you wouldn't see such strong selling.

What does make sense is that Bar A and Bar B were probably profit taking and as price was marked up sellers stepped in again.
Attached Image (click to enlarge)
Click to Enlarge

Name: EURCADH4.png
Size: 32 KB
3
  • Post #33,724
  • Quote
  • Feb 12, 2021 12:29pm Feb 12, 2021 12:29pm
  •  fokus-pokus
  • | Joined Jul 2020 | Status: Member | 6 Posts
15 video lessons from Gary Dayton:
https://disk.yandex.ru/d/KaqyUb9cdNYv1g?w=1
1
  • Post #33,725
  • Quote
  • Feb 15, 2021 3:32am Feb 15, 2021 3:32am
  •  Anotan
  • Joined Jan 2015 | Status: Member | 640 Posts
Quoting Anotan
Disliked
{quote} Its strange that you would ask someone else why i would take a sell. As far as fundamentals go, I do pay some attention to them but they don't take a front seat to my trading decisions. In VSA terms, look at Bar A and Bar B, there is buying on the pair but look at Bar C. If the pair was being accumulated with active buying across Bar A and Bar B, why is there such strong selling on Bar C? It doesn't make sense, if the pair was being actively bought you wouldn't see such strong selling. What does make sense is that Bar A and Bar B were probably...
Ignored
H4 weakness plus the widespread down bar just before Friday's close.. Should be smooth sailing down to 5320, will need to pay attention there to see if sellers will keep driving price down.

If you look at Bar A it looks like potential buyers here, but the volume doesn't match the spread which is a cause for concern. Look at Bar B, if you see a potential buying bar, like Bar A, then you see a bar like Bar B you know that the buyers are in trouble.
Attached Image (click to enlarge)
Click to Enlarge

Name: EURCADH1.png
Size: 45 KB
3
  • Post #33,726
  • Quote
  • Feb 15, 2021 5:26am Feb 15, 2021 5:26am
  •  Anotan
  • Joined Jan 2015 | Status: Member | 640 Posts
Lowered stops, risk is minimal. Original stop was about 20 pips and first area of interest is 5325 which is about 50 pips target, not a great RR.

Trade does have potential to go much lower than 5325, but do need to keep an eye on volume to see if any serious buyers step in.
Attached Image (click to enlarge)
Click to Enlarge

Name: EURCADH4.png
Size: 73 KB
2
  • Post #33,727
  • Quote
  • Feb 15, 2021 7:42am Feb 15, 2021 7:42am
  •  Anotan
  • Joined Jan 2015 | Status: Member | 640 Posts
Quoting Anotan
Disliked
Lowered stops, risk is minimal. Original stop was about 20 pips and first area of interest is 5325 which is about 50 pips target, not a great RR. Trade does have potential to go much lower than 5325, but do need to keep an eye on volume to see if any serious buyers step in. {image}
Ignored
Added a bit more, my margin is maxed out between EC short and CJ longs.

I'm done trading for the week.
Attached Image (click to enlarge)
Click to Enlarge

Name: EURCADH4.png
Size: 78 KB
4
  • Post #33,728
  • Quote
  • Feb 15, 2021 7:58pm Feb 15, 2021 7:58pm
  •  sachko1
  • | Joined Jun 2020 | Status: Junior Member | 3 Posts
Hello, there is an essential occurrence in VSA that i do not understand why it sometimes fails and more importantly how to avoid trading it. It is no follow through after climactic actions. Lets say the chart shows a selling climax with large volume like the one in my picture but then retraces a little and doesnt follow through. I get that in that picture specifically theres no change of behavior and the background is weak but I have seen it plenty where the background is not as weak as my picture and there is a change of behavior and yet the selling climax still fails to reverse the trend for a tradable leg to the long side.

The second picture is a minor issue i hope someone can chip in. It shows a no demand and a no supply right beside each other. I get its a lack of interest in the intrument in general but is there anything more to say that would help in the analysis and trading?

Thanks
Attached Images (click to enlarge)
Click to Enlarge

Name: ndns.png
Size: 138 KB Click to Enlarge

Name: volume.png
Size: 153 KB
  • Post #33,729
  • Quote
  • Feb 15, 2021 9:49pm Feb 15, 2021 9:49pm
  •  SyntaxError
  • | Joined Oct 2020 | Status: Member | 28 Posts | Online Now
Sachko

Try this .. look for what are known as Skyscraper bars (SS) .. literally a couple or one bar that is/are massively out of place and look like the empire state building

These are the VSA changes in sentiment, especially Ultra Wide Range coupled with this Ultra Wide or Ultra High Volume. Both your examples have no SS bars at the turning points you were looking for or i think expected.

Then when you have SS bars followed by NS or ND as a secondary marker you will have the fourth derivative being price movement

PLTR 30 had 1 SS bar at the LHS of your chart. Then look for ND or a failed test after and you will have confirmed weakness

The SS bars are first sign of a change and then comes the confirmation

HTH
  • Post #33,730
  • Quote
  • Feb 15, 2021 9:57pm Feb 15, 2021 9:57pm
  •  SyntaxError
  • | Joined Oct 2020 | Status: Member | 28 Posts | Online Now
Here is a good obvious example

SS bar UH Volume Narrow range following major testing at 1630 pm

It had to go up as the test was successful and SS bar showed the way

HTH
Attached Image (click to enlarge)
Click to Enlarge

Name: ScreenShot014.png
Size: 58 KB
1
  • Post #33,731
  • Quote
  • Feb 15, 2021 11:03pm Feb 15, 2021 11:03pm
  •  RickM
  • Joined Sep 2015 | Status: Member | 1,200 Posts
Quoting sachko1
Disliked
Hello, there is an essential occurrence in VSA that i do not understand why it sometimes fails and more importantly how to avoid trading it. It is no follow through after climactic actions. Lets say the chart shows a selling climax with large volume like the one in my picture but then retraces a little and doesnt follow through. I get that in that picture specifically theres no change of behavior and the background is weak but I have seen it plenty where the background is not as weak as my picture and there is a change of behavior and yet the selling...
Ignored
Hi Sachko

The issue I find is the market is moved by big players which normally offer about 1 trade a day, and market makers which offers around 10 trades a day as a group. This can only be seen on M1 as the trade is all done under one minute.
They turn the market but we need to know whether they are buyers or sellers - therefore we need to see the Delta.
This will give us a better idea whether a candle has hit a cluster of liquidity and behaving irrationally or whether we are looking at a real move. So when I see a selling climax, I need to make sure it’s a major selling climax on M1 ONLY and then wait for the buyers to enter.

Then like Syntax said, big bars show the direction thereafter and often occur in a series.
Skyscrapers bars- like that.
Trading thin liquidity at the boundary of the charts
1
  • Post #33,732
  • Quote
  • Feb 17, 2021 10:39pm Feb 17, 2021 10:39pm
  •  sachko1
  • | Joined Jun 2020 | Status: Junior Member | 3 Posts
Skyscraper bares make sense, ultra high volume. I havent seen it to be consistent enough to reverse trends or make money unless you are trading the Automatic Rally (talking about stocks only).

Im currently trying to script some VSA setups as you see in my chart. The problem is getting the sweet spot between reliable enough but not excessive. I get that its mostly discretionary im not looking to automate. Which leads me to the questions of sequences. Do you wait for the high of a selling climax to break and test or test before? These small things are what make trading had compared to analyzing. Its easy to see downbar + high volume + next bar up and say strength but its hard to trade it with some reasonable risk reward.

What sequences do you find best?
  • Post #33,733
  • Quote
  • Feb 17, 2021 11:22pm Feb 17, 2021 11:22pm
  •  RickM
  • Joined Sep 2015 | Status: Member | 1,200 Posts
Quoting sachko1
Disliked
Skyscraper bares make sense, ultra high volume. I havent seen it to be consistent enough to reverse trends or make money unless you are trading the Automatic Rally (talking about stocks only). Im currently trying to script some VSA setups as you see in my chart. The problem is getting the sweet spot between reliable enough but not excessive. I get that its mostly discretionary im not looking to automate. Which leads me to the questions of sequences. Do you wait for the high of a selling climax to break and test or test before? These small things...
Ignored
Hi Sachko

If you study M1 and have access to CME futures exchange, you will be able to see the big players absolutely dump ridiculous high volume onto to the markets. Forex price seems to react within seconds and perform the same task as will. For example on the MT4 tick volume, a big candle near a possible reversal is about 400 units. On the futures exchange, that same candle is about 10 to 30 times the size of every other close by candle on the exchange. We are talking about average candle size being around 300 units but the big candle being 4000 units.
So the issue is the large volume on the forex market is hidden from us on retail trading platforms.
My answer to your question is wait for large volume to occur, let volume collapse back to normal levels (about 150 units) then trade with current direction of delta. So you need to switch to a trading platform like Sierra Charts and study the delta footprint.

On MT4, I like to trade weak bullish candles that’s pushing price in a bullish trend after a big volume bearish clean out.

The key thing I learned is the chart contains very little liquidity close to price. When a large volume candle cleans out this liquidity, price has no choice but reverse. We are talking only 15-30 pips of dense liquidity on GBP pairs.
It was a light bulb moment for me when after I completed the maths.


Cheers
Trading thin liquidity at the boundary of the charts
4
  • Post #33,734
  • Quote
  • Feb 18, 2021 11:57pm Feb 18, 2021 11:57pm
  •  SyntaxError
  • | Joined Oct 2020 | Status: Member | 28 Posts | Online Now
I will jump in here

Follow your own method .. But for me M1 and M5 is madness .. its like watching a game of tennis with your chin on the centre net; all activity and you have no idea who is strong or weak or what is happening underneath the noise of the fricken ball blurring in front of you.. bing bang bong back forward is very confusing

VSA which is Wyckoff on steroids is about accumulation and distribution .. one needs to watch M15 and M30 and probably M60 and get into a rhythm

A market cannot and will not go up or down sustainably on very high or ultra high volume.

Try this ..

Print the attached schematic on your printer .. then line it up over your chosen pair OR currency and watch on the appropriate time frame that you as a human can manage .. look for the wyckoff points of change such as the test after spring and failed rally.

The chart will line up with the systematic at some point .. else no deal .. walk away and wait

When they line up as they will on the right timeframe and momentum you are in rhythm with ticker and timeframe and the jump the creek and falling through ice etc will stand out .. that is the time to take the trade with minimum but safe stop levels.

Long stop is below the last low volume sell off and short stop is above the failed rally

Try it and see

HTH
2
  • Post #33,735
  • Quote
  • Feb 18, 2021 11:58pm Feb 18, 2021 11:58pm
  •  SyntaxError
  • | Joined Oct 2020 | Status: Member | 28 Posts | Online Now
Attached Image (click to enlarge)
Click to Enlarge

Name: WyckoffLogicStructure.png
Size: 319 KB
3
  • Post #33,736
  • Quote
  • Feb 19, 2021 7:53am Feb 19, 2021 7:53am
  •  Anotan
  • Joined Jan 2015 | Status: Member | 640 Posts
Good day for CAD.
Attached Image (click to enlarge)
Click to Enlarge

Name: EURCADH4.png
Size: 71 KB
2
  • Post #33,737
  • Quote
  • Last Post: Feb 19, 2021 12:16pm Feb 19, 2021 12:16pm
  •  Anotan
  • Joined Jan 2015 | Status: Member | 640 Posts
This tade took some work, but I think it should be able to hit at least 5150, maybe 5050. This was a harder trade as they kept running price back to 5380.

You hear a lot that greed/fear is the reason why traders fail.. I just realized that traders are too greedy to cut their losses and they're too fearful to let their winning trades run. I always thought it was the other way around, being greedy on winning trades and giving back pips, and becoming fearful from losses and making bad trading decisions.

I was looking at a bunch of TEs its the same story over and over, traders just stacking trades that are 100s of pips against them and they have all these wins that are 25 pips and less.
Attached Image (click to enlarge)
Click to Enlarge

Name: EURCADH1.png
Size: 94 KB
1
  • Interactive Trading
  • /
  • vsa with Malcolm
  • Reply to Thread
    • 1 16821683168416851686 Page 1687
    • 1 1686 Page 1687
2 traders viewing now, 1 is a member:
13francisco
Top of Page
  • Facebook
  • Twitter
About FF
  • Mission
  • Products
  • User Guide
  • Media Kit
  • Blog
  • Contact
FF Products
  • Forums
  • Trades
  • Calendar
  • News
  • Market
  • Brokers
  • Trade Explorer
FF Website
  • Homepage
  • Search
  • Members
  • Report a Bug
Follow FF
  • Facebook
  • Twitter

FF Sister Sites:

  • Metals Mine
  • Energy EXCH
  • Crypto Craft

Forex Factory® is a brand of Fair Economy, Inc.

Terms of Service / ©2021