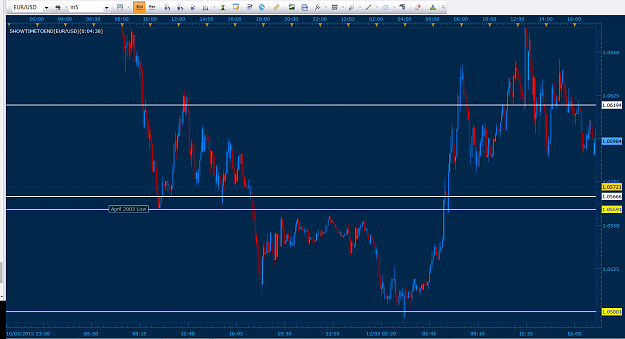
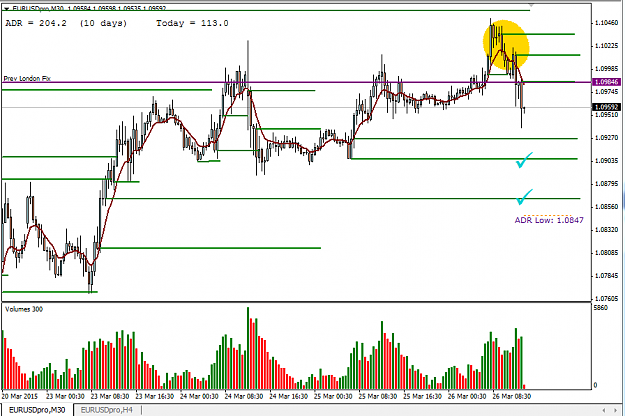
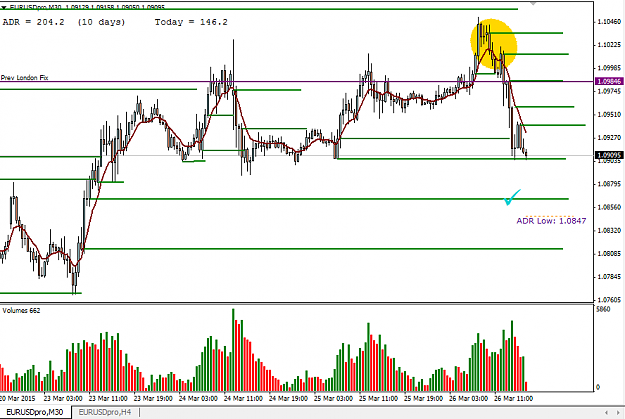
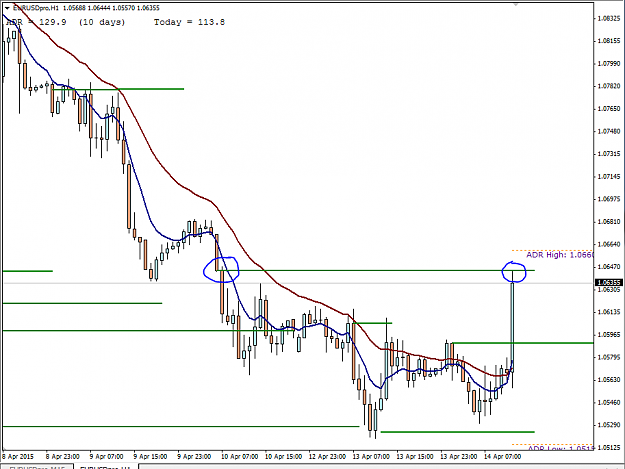
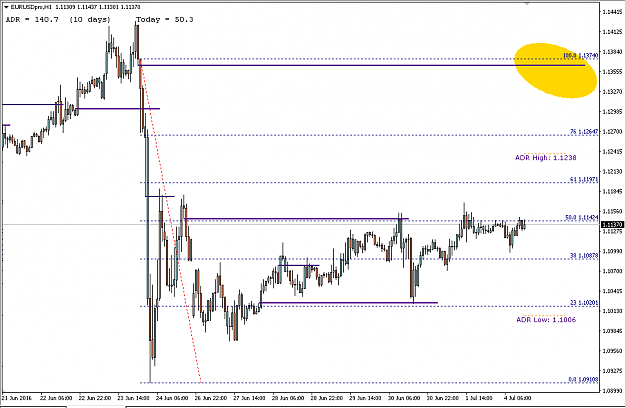
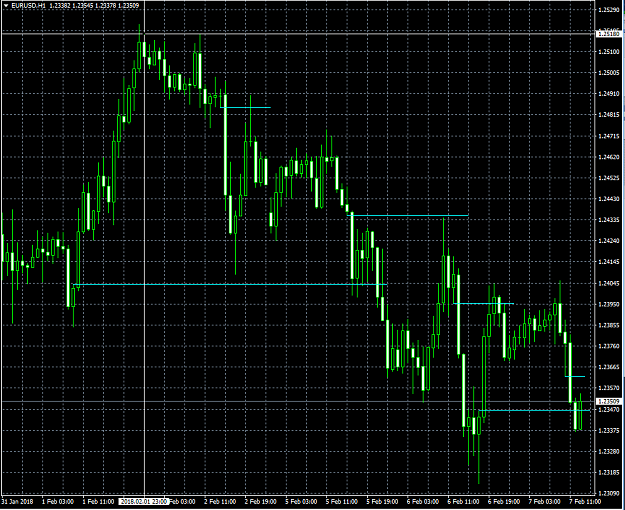
Disliked{quote} Hi Andy I dont know if you will find this relevant now I have seen few more posts but lets see.The title sparked my interest with the referral to Re-Testing Opens. Daily chart. Lots of lines, labels etc looks chaotic and makes eyes ache, you are thinking ? I Agree. But once you digest it a little some things might start to speak to you ? {image} OK 1 hr Chart still plenty of lines but maybe some things coming in to view ? {image} Zoom in a bit 5 Min, bit easier to make out whats goin on ? {image} What the hell. 1 Min chart. The lines haven't...Ignored
Hey Stu, interesting charts my man. There was a thread a while back started by a Seneca pilot who used key levels in his trading.
I see you have marked significant areas such as daily o/h/l, weekly o/h/l, but also see that you have an awful lot of historical lines.
How long do you leave levels on your chart for? When in your opinion are the 'consumed' or violated and hence can be removed? Surely if they are not removed at some point, the chart will just fill up over time.
Cheers Andy