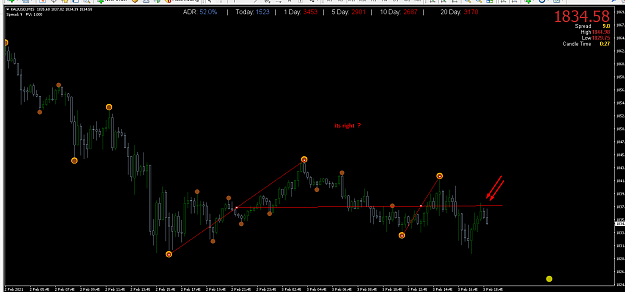
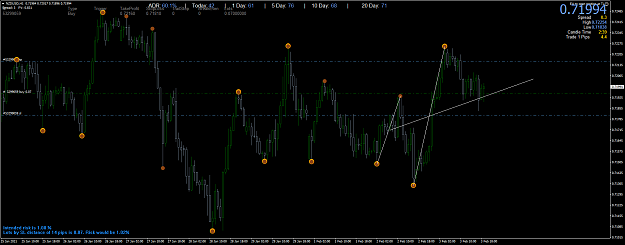
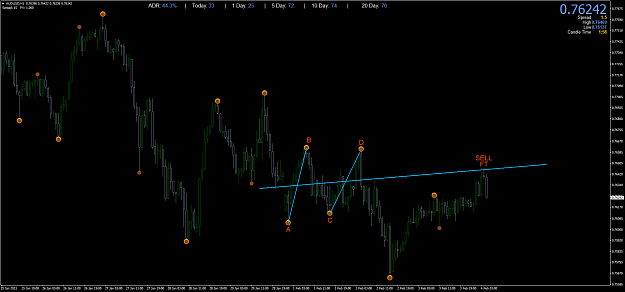
Another scenario.
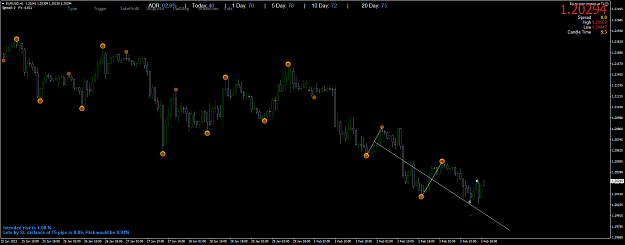
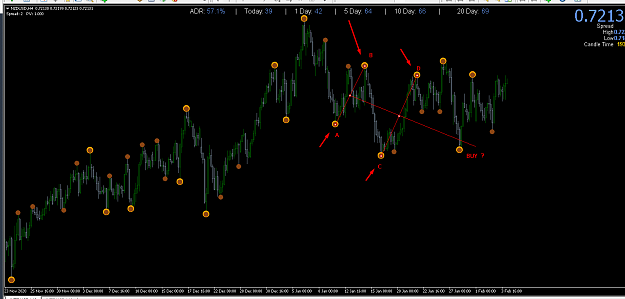
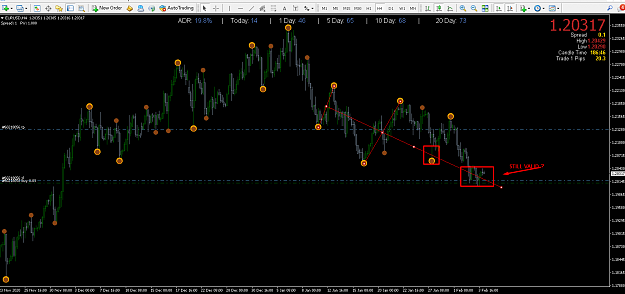
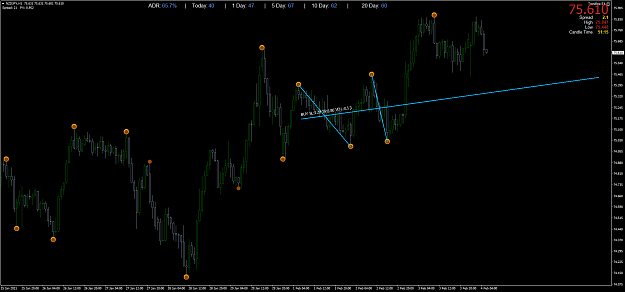
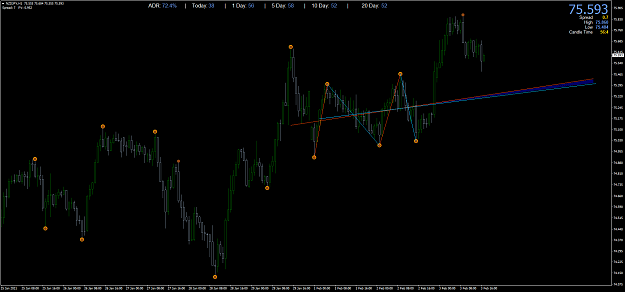
In this one, the first orange structure would have been a loser as price blasted upwards through the line. I think this corresponded with the much better than expected NZD employment numbers.
The second and most recent blue structure is still valid and untested.
Notice how close the lines are to each other. For me, this shows a nice harmonic relationship between all of the impulse waves involved and makes buying the touch a strong option to trade. Even if the lines aren't as close, many times it gives us a small zone to buy/sell from.
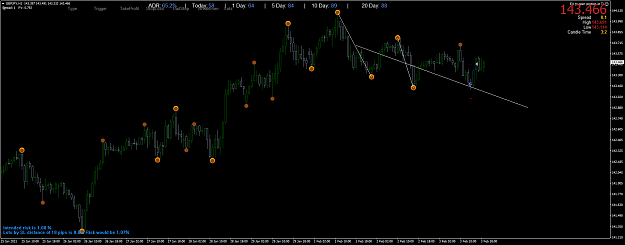
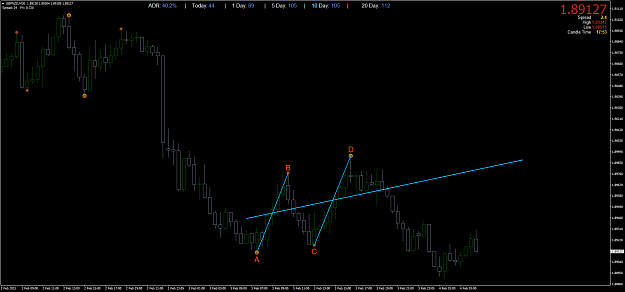
NPY/JPY 1H CHART
8am here and time to get my daughter up for breakfast and homeschooling, back later.............thanks to anyone who posts here. It helps opens my eyes to new ways of thinking.
Cheers.
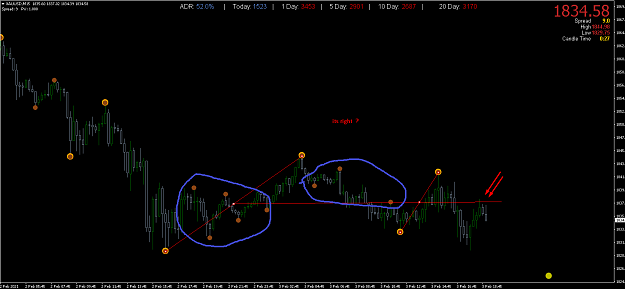
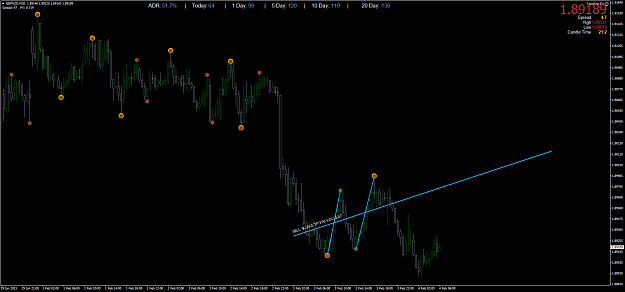
In this one, the first orange structure would have been a loser as price blasted upwards through the line. I think this corresponded with the much better than expected NZD employment numbers.
The second and most recent blue structure is still valid and untested.
Notice how close the lines are to each other. For me, this shows a nice harmonic relationship between all of the impulse waves involved and makes buying the touch a strong option to trade. Even if the lines aren't as close, many times it gives us a small zone to buy/sell from.
NPY/JPY 1H CHART
Attached Image (click to enlarge)
8am here and time to get my daughter up for breakfast and homeschooling, back later.............thanks to anyone who posts here. It helps opens my eyes to new ways of thinking.
Cheers.
Pride always comes before destruction.... -Proverbs 16:18