EDIT 6/13/23: I've restarted this thread now that I have some free time. Making videos is an easier way to communicate the strategy so feel free to check my Youtube channel. As time permits, I will be making more and more videos showing examples of what works and what doesn't. Soon I will also be live streaming on Sunday nights to go through some potential trade setups for the upcoming week.
In the meantime check out this video explaining the basic strategy:
Hello traders and welcome to the thread.
This strategy is based on fractal geometry for lack of a better term. It might sound complicated but it's really quite simple and elegant in its application. (At least I think it is). My system provides a stress-free mechanical way of looking at price action. We use manual drawing in conjunction with a modified fractal indicator. I prefer a clean chart and a clean heart.
The sole intent of this thread is to build a community of hard-working productive pip harvesters. Period.
Rules:
#1) Political/Ideological arguments will not be tolerated here.
#2) Rudeness, racial slurs, or vulgarity will also not be tolerated here.
Disclaimer: It's assumed that individuals are responsible for their own actions. My live trades are not recommendations, they are solely for the purpose of illustrating this system. Trading incurs risk and should be taken seriously. It's advised that you test this strategy on a demo account.
THE STRATEGY
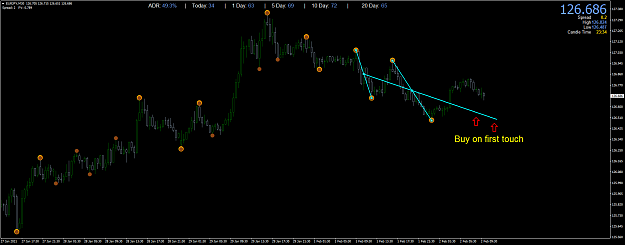
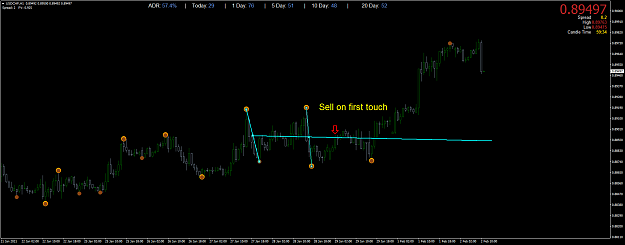
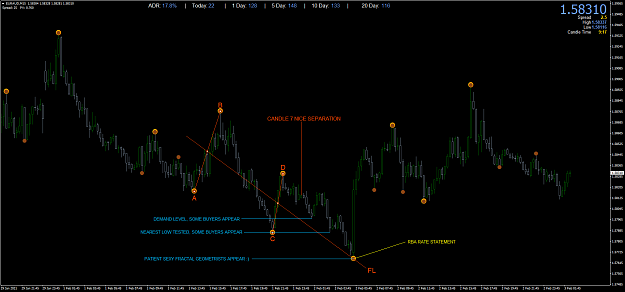
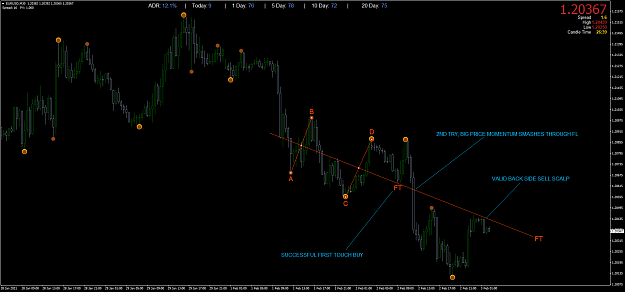
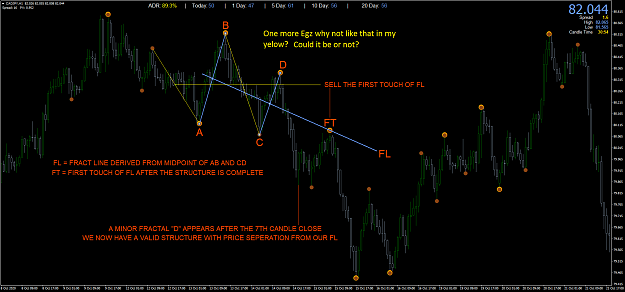
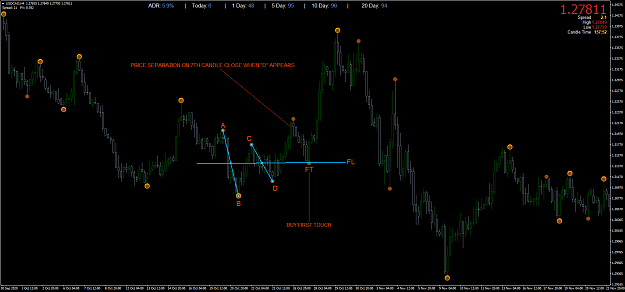
We use the "first touch" principle. This means we buy/sell based on the first touch of a fractal line.
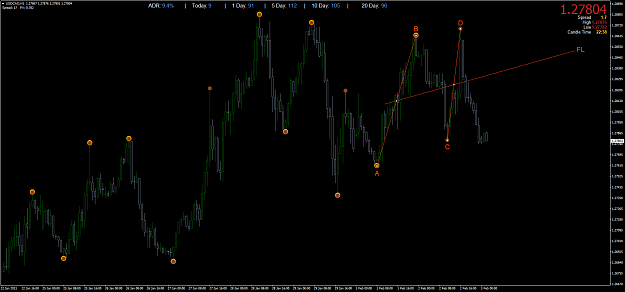
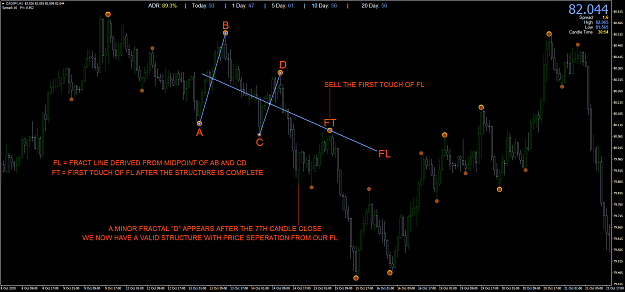
1) Fractal lines are derived by using the midpoints of impulse waves.
*****The modified fractal indicator is the basis for these derivations*****
Before discussing certain rules I think it's best to post a couple of examples for visual reference. Of course, these are cherry-picked to illustrate the strategy and to make it easier to understand these simple derivations.
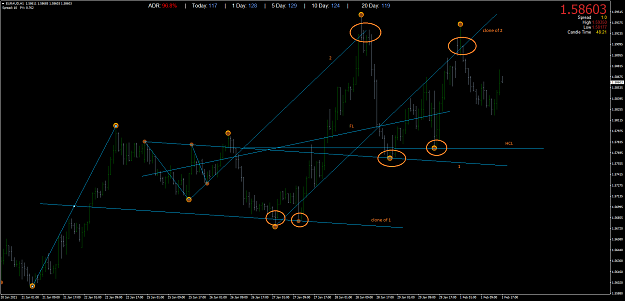
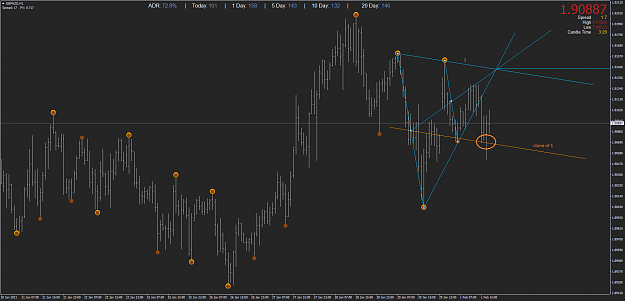
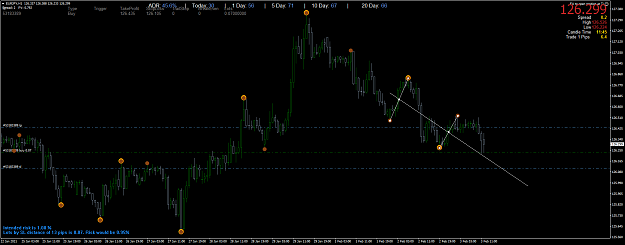
CAD/JPY 1H CHART ILLUSTRATING THE FRACTAL DIAGONAL LINE DERIVATION.
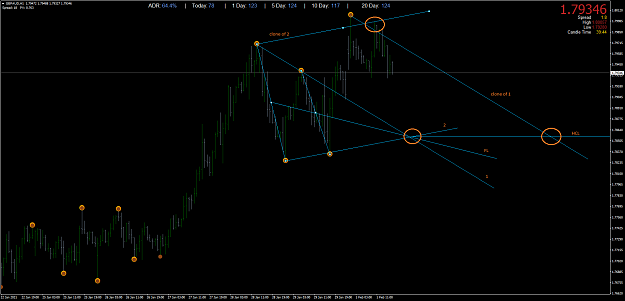
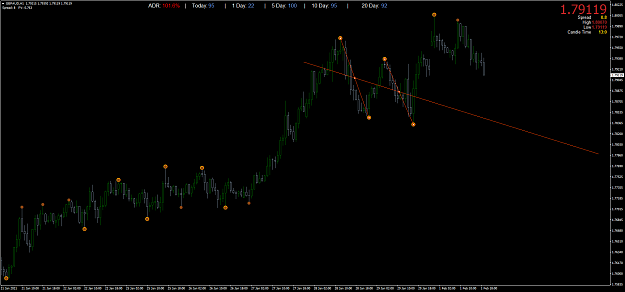
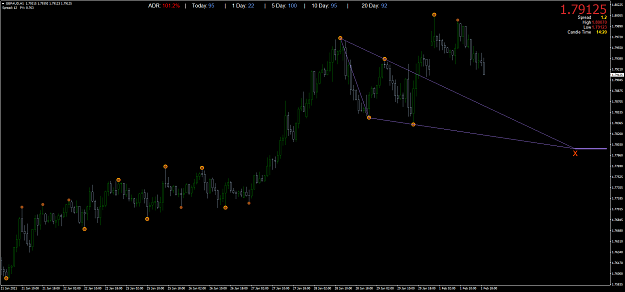
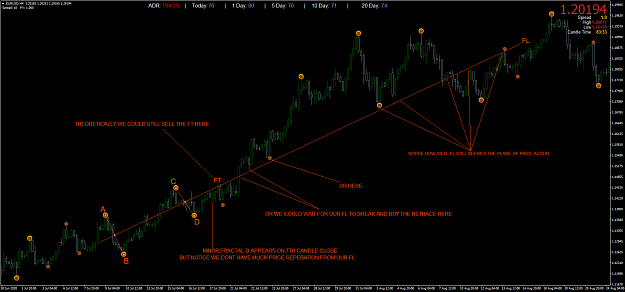
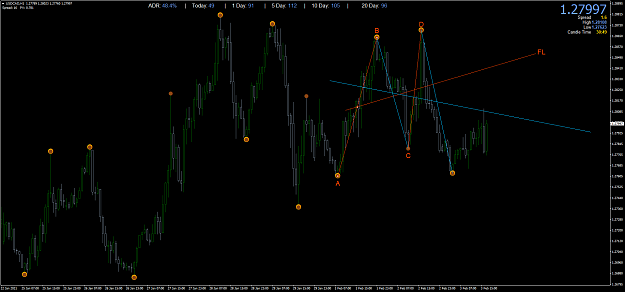
USD/CAD 4H - ANOTHER EXAMPLE
RULES/OBSERVATIONS
#1) Fractals A, B , C, and D must be alternating highs and lows and vice versa.
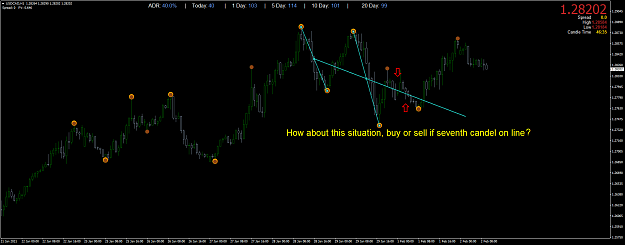
#2) Major fractals are better than minor fractals but both are valid. Fractal D is the completion of our structure and can only appear after the 7th candle close (minor fractal). Major fractals appear after the 12th candle close.
#3) There can be NO other fractals between AB, BC, or CD
#4) We are looking for "uniform" impulse waves. We don't want to see messy, jagged price action between our fractal points.
#5) When fractal D appears we can then draw our structure. At this point, we want to see "price separation" from our fractal line (FL).
#6) Be EXTREMELY accurate in your drawing making sure your fractal line goes perfectly through each impulse wave midpoint. Entries are everything and can be remarkably different if the drawing is inaccurate.
#7) Note that some brokers use New York candle close time and some don't. Also, different spreads may affect when or if a fractal actually prints so you can get different structures or no structure at all for the same pair. The theory is still valid as long as you are consistent with your drawings.
#8) You do not have to buy/sell the first touch. If you feel that there is too much fundamental momentum when price is approaching your fractal line, then you can wait to see if price breaks through your fractal line with a convincing candle close past that line. Then you can buy/sell the other side of the line upon the first retracement back to the line. In essence, this would be like a trend continuation trade.
#9) We aren't trying to predict some big trend change. We are scalping fractal lines using higher time frames.
#10) Don't hesitate to enter a bit early with a FOMO trade. Maybe one entry a few pips before the line and one on the touch, then take profits on one early and let the other run if it's going in your favor. Be creative with your micromanagement.
Indicators/Template:
Here is an indicator that was generously made by "arby1108". It draws the fractal structure simply by clicking on a fractal dot.
NOTE: It will draw an invalid structure if you click on an invalid fractal. For example, you should click on the "A" fractal that you know starts a valid setup and it will draw the structure for you. Then click "C" to clear the drawing or click "F" to lock the drawing in place. However, even when locked in place you can still double click on any line to edit it or move it around.
The EA that can open trades on your fractal lines is here with a link to the rules:
https://www.forexfactory.com/thread/...at-trend-lines
What time frame and pairs does this work for?
This strategy can be used on any pair. I find it works best for me on 30M, 1H, and 4H time frames. For pairs with a large average daily range, I will sometimes consider a 15M time frame.
What makes a good potential structure?
I've found that the most important quality of a good structure is to have impulse waves that are fairly uniform and that are not too close together, not too short, not too long. There can be no other fractals inside any impulse wave. The structure consists of 4 fractals. The fractals can be minor or major. Minor fractals have a period of 7 candles. Major fractals have a period of 12 candles.
I suggest scouring your charts and looking for some nice even impulse waves and then drawing your structure to see what happened. After a while, finding these simple structures will become very easy.
How to set SL/TPs?
This is a personal choice but this is how I do it. I use a percentage of the 20-day average daily range (ADR indicator).
For example, let's assume our pair has a 20 day ADR OF 100 PIPS.
M30 CHART:
SL = 10-15% of 100 pips = 10-15 pips
TP = 20% of 100 pips = 20 pips
H1 CHART:
SL = 15-20% of 100 pips = 15-20 pips
TP = 30% of 100 pips = 30 pips
H4 CHART:
SL = 20-25% of 100 pips = 20-25 pips
TP = 40% of 100 pips = 40 pips
In this way, I can figure out my risk management parameters in advance and have them set in stone before the trade activates. This is only a general guideline. Each trader and each trade is unique so be creative and tailor your risk management in a way that works for you.
What if my trade gets stopped out?
No problem assuming you have used prudent risk management. If my trade gets stopped out, it tells me that price has strong momentum. If my trade was a sell of the first touch and I get stopped out, I just wait for a retrace back to the fractal line and buy on the retouch of the same line. And vice versa.
******************************************************************************************************************
In the meantime check out this video explaining the basic strategy:
Inserted Video
Hello traders and welcome to the thread.
This strategy is based on fractal geometry for lack of a better term. It might sound complicated but it's really quite simple and elegant in its application. (At least I think it is). My system provides a stress-free mechanical way of looking at price action. We use manual drawing in conjunction with a modified fractal indicator. I prefer a clean chart and a clean heart.
The sole intent of this thread is to build a community of hard-working productive pip harvesters. Period.
Rules:
#1) Political/Ideological arguments will not be tolerated here.
#2) Rudeness, racial slurs, or vulgarity will also not be tolerated here.
Disclaimer: It's assumed that individuals are responsible for their own actions. My live trades are not recommendations, they are solely for the purpose of illustrating this system. Trading incurs risk and should be taken seriously. It's advised that you test this strategy on a demo account.
THE STRATEGY
We use the "first touch" principle. This means we buy/sell based on the first touch of a fractal line.
1) Fractal lines are derived by using the midpoints of impulse waves.
*****The modified fractal indicator is the basis for these derivations*****
Before discussing certain rules I think it's best to post a couple of examples for visual reference. Of course, these are cherry-picked to illustrate the strategy and to make it easier to understand these simple derivations.
CAD/JPY 1H CHART ILLUSTRATING THE FRACTAL DIAGONAL LINE DERIVATION.
Attached Image (click to enlarge)
USD/CAD 4H - ANOTHER EXAMPLE
Attached Image (click to enlarge)
RULES/OBSERVATIONS
#1) Fractals A, B , C, and D must be alternating highs and lows and vice versa.
#2) Major fractals are better than minor fractals but both are valid. Fractal D is the completion of our structure and can only appear after the 7th candle close (minor fractal). Major fractals appear after the 12th candle close.
#3) There can be NO other fractals between AB, BC, or CD
#4) We are looking for "uniform" impulse waves. We don't want to see messy, jagged price action between our fractal points.
#5) When fractal D appears we can then draw our structure. At this point, we want to see "price separation" from our fractal line (FL).
#6) Be EXTREMELY accurate in your drawing making sure your fractal line goes perfectly through each impulse wave midpoint. Entries are everything and can be remarkably different if the drawing is inaccurate.
#7) Note that some brokers use New York candle close time and some don't. Also, different spreads may affect when or if a fractal actually prints so you can get different structures or no structure at all for the same pair. The theory is still valid as long as you are consistent with your drawings.
#8) You do not have to buy/sell the first touch. If you feel that there is too much fundamental momentum when price is approaching your fractal line, then you can wait to see if price breaks through your fractal line with a convincing candle close past that line. Then you can buy/sell the other side of the line upon the first retracement back to the line. In essence, this would be like a trend continuation trade.
#9) We aren't trying to predict some big trend change. We are scalping fractal lines using higher time frames.
#10) Don't hesitate to enter a bit early with a FOMO trade. Maybe one entry a few pips before the line and one on the touch, then take profits on one early and let the other run if it's going in your favor. Be creative with your micromanagement.
Indicators/Template:
Attached File(s)
Attached File(s)
Attached File(s)
Attached File(s)
Attached File(s)
Attached File(s)
Here is an indicator that was generously made by "arby1108". It draws the fractal structure simply by clicking on a fractal dot.
NOTE: It will draw an invalid structure if you click on an invalid fractal. For example, you should click on the "A" fractal that you know starts a valid setup and it will draw the structure for you. Then click "C" to clear the drawing or click "F" to lock the drawing in place. However, even when locked in place you can still double click on any line to edit it or move it around.
Attached File(s)
The EA that can open trades on your fractal lines is here with a link to the rules:
https://www.forexfactory.com/thread/...at-trend-lines
Attached File(s)
What time frame and pairs does this work for?
This strategy can be used on any pair. I find it works best for me on 30M, 1H, and 4H time frames. For pairs with a large average daily range, I will sometimes consider a 15M time frame.
What makes a good potential structure?
I've found that the most important quality of a good structure is to have impulse waves that are fairly uniform and that are not too close together, not too short, not too long. There can be no other fractals inside any impulse wave. The structure consists of 4 fractals. The fractals can be minor or major. Minor fractals have a period of 7 candles. Major fractals have a period of 12 candles.
I suggest scouring your charts and looking for some nice even impulse waves and then drawing your structure to see what happened. After a while, finding these simple structures will become very easy.
How to set SL/TPs?
This is a personal choice but this is how I do it. I use a percentage of the 20-day average daily range (ADR indicator).
For example, let's assume our pair has a 20 day ADR OF 100 PIPS.
M30 CHART:
SL = 10-15% of 100 pips = 10-15 pips
TP = 20% of 100 pips = 20 pips
H1 CHART:
SL = 15-20% of 100 pips = 15-20 pips
TP = 30% of 100 pips = 30 pips
H4 CHART:
SL = 20-25% of 100 pips = 20-25 pips
TP = 40% of 100 pips = 40 pips
In this way, I can figure out my risk management parameters in advance and have them set in stone before the trade activates. This is only a general guideline. Each trader and each trade is unique so be creative and tailor your risk management in a way that works for you.
What if my trade gets stopped out?
No problem assuming you have used prudent risk management. If my trade gets stopped out, it tells me that price has strong momentum. If my trade was a sell of the first touch and I get stopped out, I just wait for a retrace back to the fractal line and buy on the retouch of the same line. And vice versa.
******************************************************************************************************************
Pride always comes before destruction.... -Proverbs 16:18