Very informative thread indeed.
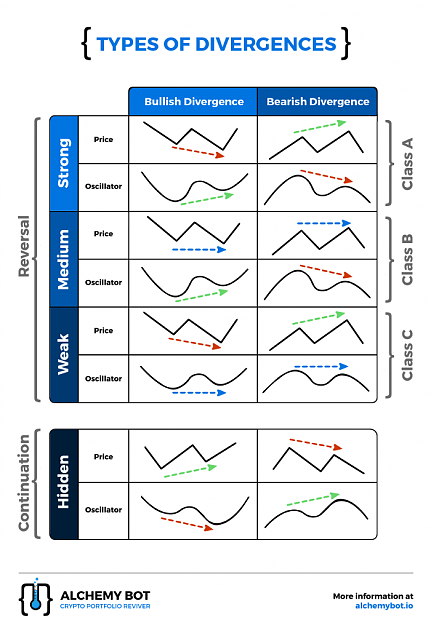
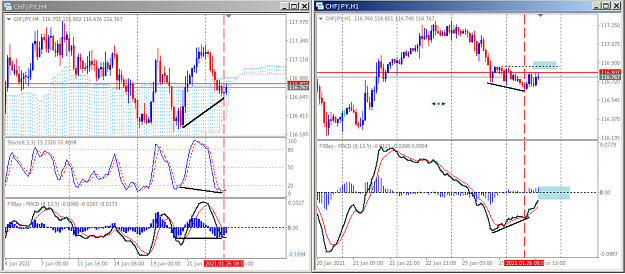
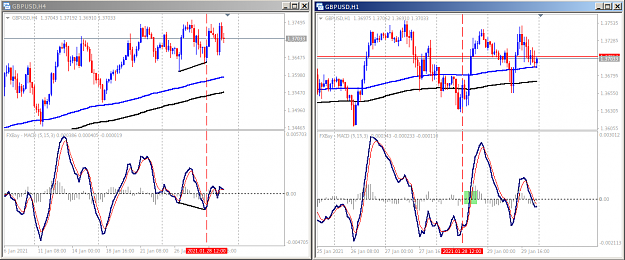
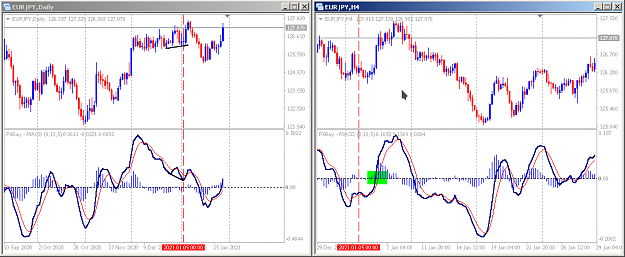
Is there an indicator (preferably RSI) that helps spot the hidden divergence. In fact, divergence is realized after a top or bottom is in place. However I prefer to spot HD relative to EMA200. When price is above EMA200 we only look for bullish HD and long trade and vice versa. The point in price to check HD against is when price to close or touching EMA200.
Please take a look at
It would be great if it can be done as EA for almost mechanical trading strategy.
Is there an indicator (preferably RSI) that helps spot the hidden divergence. In fact, divergence is realized after a top or bottom is in place. However I prefer to spot HD relative to EMA200. When price is above EMA200 we only look for bullish HD and long trade and vice versa. The point in price to check HD against is when price to close or touching EMA200.
Please take a look at
Inserted Video
It would be great if it can be done as EA for almost mechanical trading strategy.
1