• Home
  • Forums
  • Trades
  • News
  • Calendar
  • Market
  • Brokers
  • Login
  • Join
  • User/Email: Password:
  • 6:30pm
Menu
  • Forums
  • Trades
  • News
  • Calendar
  • Market
  • Brokers
  • Login
  • Join
  • 6:30pm
Sister Sites
  • Metals Mine
  • Energy EXCH
  • Crypto Craft

Options

Bookmark Thread

First Page First Unread Last Page Last Post

Print Thread

Similar Threads

Divergence and hidden Divergence 122 replies

Hidden Pending Order and Hidden Trailing Stop Ea pls 4 replies

long eur/jpy, gbp/jpy, usd/jpy 11 replies

Hidden Divergence 7 replies

hidden stop loss 8 replies

  • Trading Discussion
  • /
  • Reply to Thread
  • Subscribe
  • 6
Attachments: Hidden Technical on Usd/Jpy
Exit Attachments
Tags: Hidden Technical on Usd/Jpy
Cancel

Hidden Technical on Usd/Jpy

  • Post #1
  • Quote
  • First Post: Edited 12:57pm Sep 10, 2007 10:28am | Edited 12:57pm
  •  Warper
  • | Joined Feb 2007 | Status: The Real Deal | 463 Posts
Hi.

First of all i must tell you that this is not some sort of teaching thread, this is just a curiosity that i have, to know if anyone is paying attention to a "low visibility" technical level that i've been watching in a few pairs.

I would like to thank in advance to the ones who awnser to my question in the end.

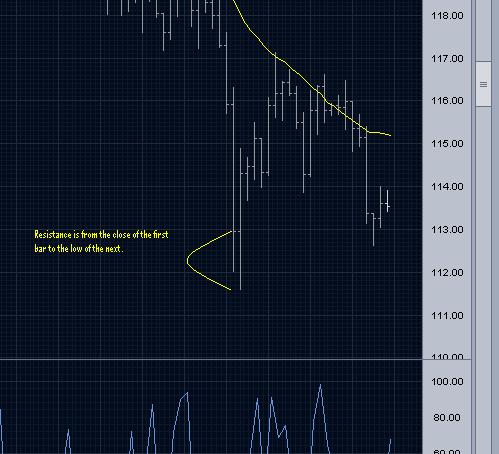
Recently i found out that the price rebounds at certain levels that on the first view we can't find any clear support/resistance to explain. Most of us automatically view it as a new level but in fact that level was completly based on previews elements forgotten by almost everyone.

They tend to have medium term characteristics and appear mostly after big movements, so i started to wonder why do this levels react with so much perfection if i dont see anyone talking about it, i don't see any site teaching it.

So i'm guessing, that this maybe the big wall between the big money and us normal investors. I once read in this forum that in forex the much talked "smart money" are the central banks. They are the ones who form long term trends based on the needs to a currency to drop or rise but in a sustained way, slowly through time, not in a day after day manner like if they decided in every meeting what to do. They know what to do many months before they reach their goals.

So until they change their minds, even if we see collapses in between, there is one certain level that will not change...

They might rise rates but they sell their currency to maintain a certain rising rate that will not change whatever it happens. And probably where Forex Options Traders base all of their analysis to know where will be a certain currency very long time from now.

I can't disclose this possible finding right now, because i incur in the risk of talking about a thing that everybody knows or that doesn't work many times.


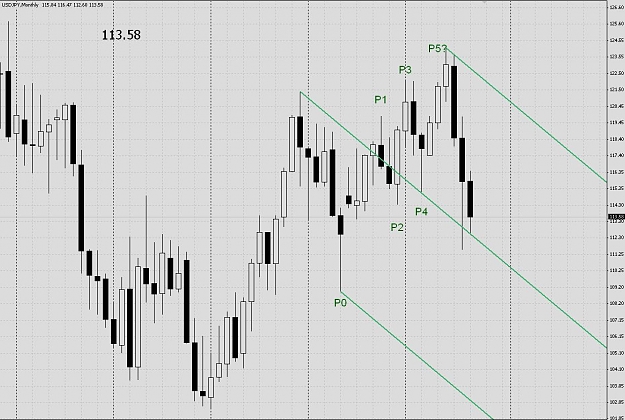
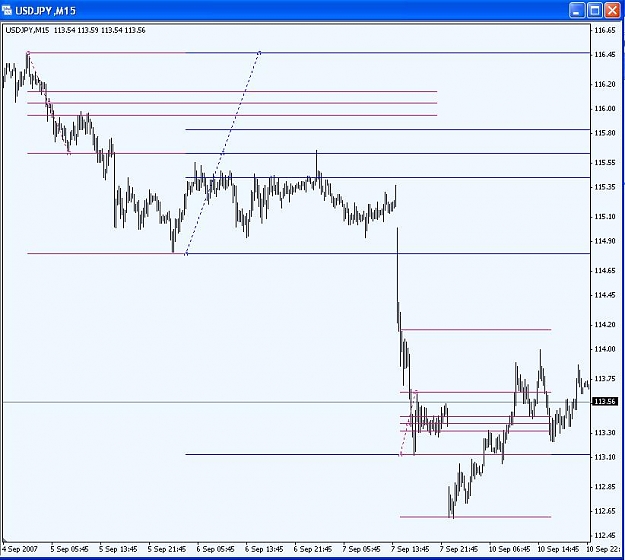
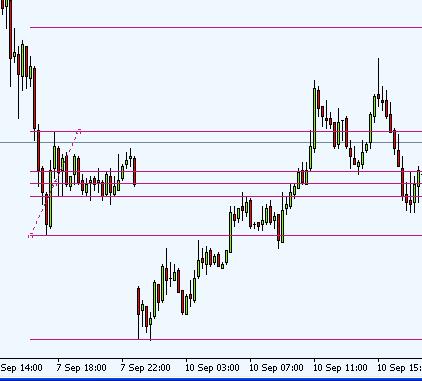
I'm just in a testing fase and i would like to ask a simple question to know how many ppl are realizing this way of finding medium term supports and resistances. Until now i found it in GU, GY, and UJ but i believe that its just a matter of time to find it in more pairs.


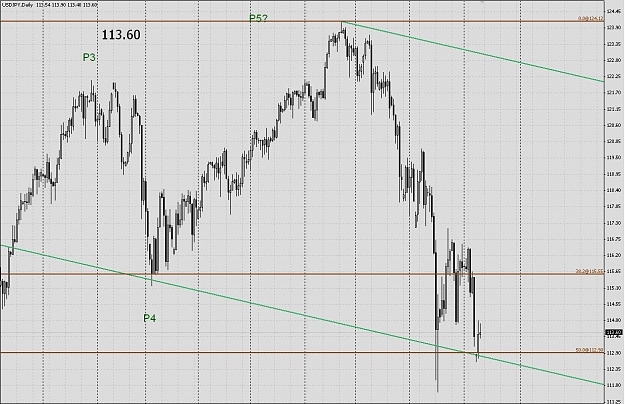
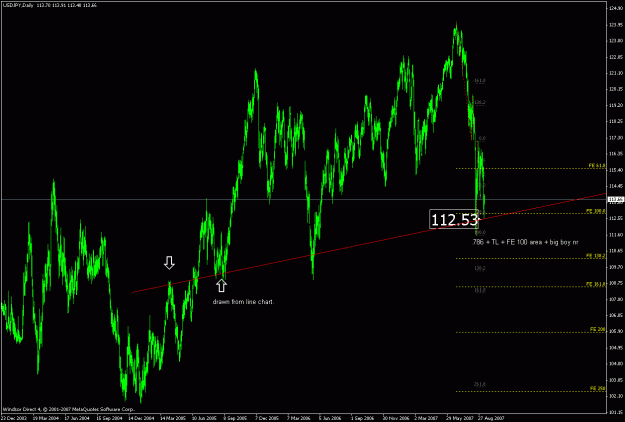
So for example... Can anyone tell me why did UJ stopped at 112.58 yesterday?

(Don't confuse with 111.58 the 08/16/07 daily low ! It's 100 pips below.)

What does that 112.58 support means? Mindless profit taking there? Mindless buying there? Or something else very accurate?


PS: If i realize that many ppl know what i'm talking about, i will just give another examples that i found out, and maybe close the thread since it was just a curiosity.

Thanks
  • Post #2
  • Quote
  • Edited 11:50am Sep 10, 2007 11:37am | Edited 11:50am
  •  smjones
  • Joined Mar 2006 | Status: THANK YOU MERLIN,TWEE and FF Team | 4,603 Posts
Well I don't think that is a good example, because it was a reaction to support of the daily low of 08/16/07.

Edit, I changed my mind about my statement and will post a more accurate statement.
 
 
  • Post #3
  • Quote
  • Sep 10, 2007 12:53pm Sep 10, 2007 12:53pm
  •  HalifaxCB
  • | Joined Apr 2007 | Status: Ich habe genug | 551 Posts
My own guess is that it's tied into the Chinese trading band of 1/2% on the USD, 3% on the others.
 
 
  • Post #4
  • Quote
  • Sep 10, 2007 1:52pm Sep 10, 2007 1:52pm
  •  ScottH
  • | Joined Nov 2005 | Status: Trend trader | 297 Posts
This may be your answer

http://www.investopedia.com/articles.../04/122204.asp
 
 
  • Post #5
  • Quote
  • Sep 10, 2007 2:23pm Sep 10, 2007 2:23pm
  •  HalifaxCB
  • | Joined Apr 2007 | Status: Ich habe genug | 551 Posts
Quoting ScottH
Disliked
This may be your answer

http://www.investopedia.com/articles.../04/122204.asp
Ignored
Great point + a nice little article, and to be truthful it should have been my first guess. But alas it wasn't
 
 
  • Post #6
  • Quote
  • Sep 10, 2007 2:34pm Sep 10, 2007 2:34pm
  •  Dopey
  • Joined Apr 2005 | Status: Dopey Bastard | 1,568 Posts
Damned if I know.
Attached Image (click to enlarge)
Click to Enlarge

Name: JPY_Monthly.jpg
Size: 131 KB
 
 
  • Post #7
  • Quote
  • Sep 10, 2007 5:31pm Sep 10, 2007 5:31pm
  •  Warper
  • | Joined Feb 2007 | Status: The Real Deal | 463 Posts
ScottH thank you for the link, but i know what intervencion is.

The best examples of intervencion were on NZD pairs a few months ago.

NZD/USD droping 50 pips in 1 minute was a fun thing to watch lol.


Anyway, the reason i talked about central banks was just to create a context. I'm just looking for opinions about the technical that made UJ stop at 112.58 yesterday.


Dopey thanks for your input and its incredible one thing... despite your analysis seem to be right almost by the pip, is not the same view that i have, and my view is also right by the pip.

Which makes me believe that 112.58 was in the middle of a mega convergence of 2 completly different medium term levels and if the fundamentals dont drag more this pair, technically this is the bottom for now.


I'm still confident in my view because i just realized a few minutes ago that its been repeating by the pip in previous ocasions in the same pair and very recently.

I have to confess that i don't really understand what is the meaning of that line that starts in a top and goes drilling through months of price until someday like yesterday ppl decide to take it as support, having more chances in the past to do it and they didn't.

It seems something random.

(Edit: I'm noticing Ew count there. I'm not a fan of Ew but i guess the lines are supposed to be interpreted with the count right? Well, it looks wierd.)


My view is about a certain rate/speed of rising that keeps repeating and has been present since 2006 on UJ.

I'm sorry if i'm being very vague but as i said its just a test to see if i'm alone on this.

I'm realizing that no one is even close, so, if i don't see more opinions, i will assume that the best thing to do is remain silent about this "ghost tech".
 
 
  • Post #8
  • Quote
  • Sep 10, 2007 5:42pm Sep 10, 2007 5:42pm
  •  ScottH
  • | Joined Nov 2005 | Status: Trend trader | 297 Posts
Quoting Warper
Disliked
My view is about a certain rate/speed of rising that keeps repeating and has been present since 2006 on UJ.

I'm sorry if i'm being very vague but as i said its just a test to see if i'm alone on this.

I'm realizing that no one is even close, so, if i don't see more opinions, i will assume that the best thing to do is remain silent about this "ghost tech".
Ignored

A quick look back and it seems like after a bottom, there is likely to be another strong bottom after ~200 hourly candles, give or take a few hours, just an observation
 
 
  • Post #9
  • Quote
  • Sep 10, 2007 5:55pm Sep 10, 2007 5:55pm
  •  Warper
  • | Joined Feb 2007 | Status: The Real Deal | 463 Posts
Well, is more about specific values. I can tell you that, it is in the family of the trend lines.

My theory of what happens is something like this...

Someone wants that, by the end of a X ammount of time in a certain period the average price rises Y per every hour passed in that time.

Is not about MAs... because MAs input values from the past at everytime.


This is more like....


From January 16th to April 16th (clear specific period) the average rising per every 4 hours must be 3 pips for example...

This will lead to this calculation, (April 16th price - January 16th price) / Z hours must be = to a certain number.

This seems to be wierd, but believe me. Uj followed the same average rising 3 times since 2006 until now, which makes me believe that someone is behind that.
 
 
  • Post #10
  • Quote
  • Sep 10, 2007 6:02pm Sep 10, 2007 6:02pm
  •  ScottH
  • | Joined Nov 2005 | Status: Trend trader | 297 Posts
interesting theory, but how exactly do you select the starting of the period?
 
 
  • Post #11
  • Quote
  • Sep 10, 2007 6:22pm Sep 10, 2007 6:22pm
  •  Warper
  • | Joined Feb 2007 | Status: The Real Deal | 463 Posts
On UJ it seems to start after every major collapse of the pair, and after a few stabilization of that same collapse, that repetitive average rise gets in place.


The ending period seems to be undetermined because new collapses are unpredictable, but until that major sell offs happen, the rising have a very stable rate, and the most interesting is that, even after a good breakout in between, in the end the price is where it should be to remain on that average.

I'm saying almost everything.
 
 
  • Post #12
  • Quote
  • Edited 3:42am Sep 11, 2007 2:52am | Edited 3:42am
  •  Marrethiel
  • | Joined Feb 2007 | Status: Member | 313 Posts
In my view there are two things to consider.
The first is that resistance isn't a specific point but rather a zone. The price had gone past the close of 16 August (on my chart) of 112.94 which I had as resistance.
Secondly, there are people behind thse trades that may have just decided to buy or close shorts... You can statistically analyse a group of people but not an individual (natural or corporation).
Attached Image
 
 
  • Post #13
  • Quote
  • Sep 11, 2007 4:46am Sep 11, 2007 4:46am
  •  rangebound
  • Joined Aug 2006 | Status: Member | 236 Posts
Nothing hidden here ... its the range breakouts 100% target.

Countless examples exist on a daily basis, On all timeframes from 1min through weekly. Obviously the higher the time frame the less frequent, and usually not quite as accurate (to the pip) as this example.

You can expect serious profit taking at these levels which leads pullbacks. Scalpers usually jump in on these retracements gunning for the breakout level, in the meantime other traders close trades as they see their profits dwindling. Ultimately bigger players will then jump back in for and causing the next leg down.


Of course in these examples, a certain amount of carry unwinding is occuring, which is actually profit (or loss) taking from longs that have been held for sometime. This adds fuel to the flames, but also explains to some extent why the pullbacks at the 100% levels are weak in relation to the moves that got them there.

In the larger view you can see how the 3 ranges played out. (all prices quoted as estimates) The top range (116.50 - 115.60) hit target at 114.80, which retraced and tested the original breakout level, where it was violently sold off (poss stop hunt), the secondary blue range (116.50-114.80) then broke and hit target at 113.15, here the profit take was very weak but lead to the eond of friday range (113.65-113.15) which despite the gap down hit target at 112.58.

Of course the real tricky bit is working out which range the big money is targeting


Hope this helps.
Attached Image (click to enlarge)
Click to Enlarge

Name: JPYrangetgt2.JPG
Size: 68 KB
Attached Image
 
 
  • Post #14
  • Quote
  • Sep 11, 2007 7:33am Sep 11, 2007 7:33am
  •  Dopey
  • Joined Apr 2005 | Status: Dopey Bastard | 1,568 Posts
Quoting Warper
Disliked

Dopey thanks for your input and its incredible one thing... despite your analysis seem to be right almost by the pip, is not the same view that i have, and my view is also right by the pip.

Which makes me believe that 112.58 was in the middle of a mega convergence of 2 completly different medium term levels and if the fundamentals dont drag more this pair, technically this is the bottom for now.


I'm still confident in my view because i just realized a few minutes ago that its been repeating by the pip in previous ocasions in the same pair and very recently.

I have to confess that i don't really understand what is the meaning of that line that starts in a top and goes drilling through months of price until someday like yesterday ppl decide to take it as support, having more chances in the past to do it and they didn't.

It seems something random.

(Edit: I'm noticing Ew count there. I'm not a fan of Ew but i guess the lines are supposed to be interpreted with the count right? Well, it looks wierd.)
Ignored
Hi Warper,

The count is actually not EW but the method Dr. Andrews used. It does the same thing though in that it tries to identify potential turning points.

I tend to agree with the later posters in that it's about zones and the natural activity of the different types of traders.

As far as Pitch Fork theory goes, there should be somewhat of a bounce off the median line here and so far it's peaked at about 125 pips. It has now tested it twice and bounced. I'll go long on another test and hold.

Btw, here's another shot showing the chart on the daily level with the price bouncing off a 50 Fib. That makes for a nice confluence.
Attached Image (click to enlarge)
Click to Enlarge

Name: JPY_Daily_Sep_11.jpg
Size: 147 KB
 
 
  • Post #15
  • Quote
  • Sep 11, 2007 7:45am Sep 11, 2007 7:45am
  •  SeekingLight
  • Joined Jul 2006 | Status: Charts + PA > * | 3,251 Posts
Only found 4 reasons


TL drawn from line chart, .786 from last mini swing up, a FE projection and the 112.5 round / big boy nr. Just like 110, 115, 117.5 120....the chart will show s/r at proximity of these "obvious" levels.


I'm sure if only I looked close I could also find MAs and more TLs and whatnot.

If you like Gann and EW there's also time cycles, time fibs etc pp...
Attached Image (click to enlarge)
Click to Enlarge

Name: usdjpy_110907_bounce.gif
Size: 27 KB
Trust price. Know yourself.
 
 
  • Post #16
  • Quote
  • Last Post: Edited 8:50am Sep 11, 2007 8:23am | Edited 8:50am
  •  Warper
  • | Joined Feb 2007 | Status: The Real Deal | 463 Posts
LoL

Well i give you guys that. Rare are the supports on forex that don't have one thousand confluences if we search for it.

As i once said, if we input in our charts MAs with 1 to 10000000 periods, i'm sure one of them will be right at that spot.


However, and i don't mean to criticize but until now i'm still only seing drilling lines throught months of price that conveniently end there without any meaning and wierd fibos.

I have to say that its kind of difficult to believe that the big money watch every single sub TL that originates from every All Time low or high in the past to know if it stops there.

Anyway, i thank you again. I want to show you my examples because i'm incurring in the risk right now of some of you thinking that i'm crazy or it might be a stupid newb thing. But, i don't really care lol


... i believe my view converges a technical specific key level with an obvious fundamental meaning that involves the carry trades and their known sable growth environment needed on that same carries to remain "healthy". Which originated the average rate of rising that i've been talked about and keeps repeating.

Unfortunally, i might be "newbie" (less than one year) but i'm not stupid. If this incredible powerful pattern is conducting this pair by the pip since 2006 i would be an idiot to tell the world my finding, without making money from it first. I might tell, but with my pockets filled.


Good trading for you all.
 
 
  • Trading Discussion
  • /
  • Hidden Technical on Usd/Jpy
  • Reply to Thread
0 traders viewing now
Top of Page
  • Facebook
  • Twitter
About FF
  • Mission
  • Products
  • User Guide
  • Media Kit
  • Blog
  • Contact
FF Products
  • Forums
  • Trades
  • Calendar
  • News
  • Market
  • Brokers
  • Trade Explorer
FF Website
  • Homepage
  • Search
  • Members
  • Report a Bug
Follow FF
  • Facebook
  • Twitter

FF Sister Sites:

  • Metals Mine
  • Energy EXCH
  • Crypto Craft

Forex Factory® is a brand of Fair Economy, Inc.

Terms of Service / ©2023