• Home
  • Forums
  • Trades
  • News
  • Calendar
  • Market
  • Brokers
  • Login
  • Join
  • User/Email: Password:
  • 3:06pm
Menu
  • Forums
  • Trades
  • News
  • Calendar
  • Market
  • Brokers
  • Login
  • Join
  • 3:06pm
Sister Sites
  • Metals Mine
  • Energy EXCH
  • Crypto Craft

Options

Bookmark Thread

First Page First Unread Last Page Last Post

Print Thread

Similar Threads

100-200MA 1 Hour Time Frame 327 replies

USDJPY pulling back to 200MA 2 replies

Trading 24 hours per day, 5 days per week 14 replies

  • Recycle Bin
  • /
  • Reply to Thread
  • Subscribe
  • 14
Attachments: (binned per thread starter’s request) 200MA f(x) Trading
Exit Attachments

(binned per thread starter’s request) 200MA f(x) Trading

  • Last Post
  •  
  • 1 23 Page 4
  • 1 23 Page 4
  •  
  • Post #61
  • Quote
  • Jan 15, 2021 2:13am Jan 15, 2021 2:13am
  •  tzamo
  • Joined Nov 2017 | Status: Member | 716 Posts
Quoting MnrComposite
Disliked
Space, Time & Ergodicity When you first look at a price chart, you see that we are watching price evolve over 2 axes, price and time. And as you watch the price trade, it appears that these 2 axes are linked and are moving together. But… are they really? When you step back and think about it, you will find that the 2 axes are completely different, in terms of their drivers. The time axis moves along at whatever constant rate you arbitrarily selected while the price access is entirely driven by actual orders trading over the bid-ask spread. For some,...
Ignored
Hey MnrComposite,
I do see what you are saying about the price axis, driven by buying and selling
The following example you had given though... Yes, the expected value is positive if we look at the expectancy. However, there is failure to check if we can play the game enough times to make use of this positive expectancy in the long run. I do not think this was demonstrated and it was not clear if 40% of initial amount or 40% of current balance is used.

If one was to play this game, common sense should have triggered and said: 'Hey, 50% chance...If I lose 40% each time, how many times can I play (if risking 40% of initial value each time)?' It would be 2 times..and then one would go bust... Then considering what would be the likely chance we would see 2x losses in a row when we first start to play... Well, 0.5 * 0.5 = 0.25...meaning that we would have 25% chance to go bust if we start playing this game right in the first 2 trades... However, if one does not mind going 'bust' a few times and starting again; It should make profit in the long run from what I can see in my example, if the risk remains 40% of initial investment (since we are not just talking about a random 40%, but 40% of something).
Attached Image (click to enlarge)
Click to Enlarge

Name: 1afa49c2653029a92ee82bc97ce87465.png
Size: 34 KB


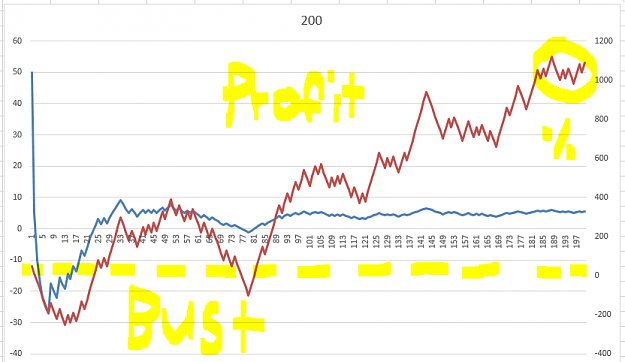
If the example was risking 40% of current balance, then I would say the average expectancy may not be calculated accurately as now the weightings of each 'trade' are no longer in balance. My rough estimate is that it will be a range from -75% to 600% using 100 trade sample sizes...So the expectancy would look exponential/ parabolic and luck will determine what way it goes it seems ^_^
"Only you can Make the Future you will be proud to be a part of..." -Me
 
2
  • Post #62
  • Quote
  • Jan 15, 2021 10:38am Jan 15, 2021 10:38am
  •  MnrComposite
  • Joined Nov 2020 | Status: Member | 68 Posts
Quoting tzamo
Disliked
{quote} Hey MnrComposite, I do see what you are saying about the price axis, driven by buying and selling The following example you had given though... Yes, the expected value is positive if we look at the expectancy. However, there is failure to check if we can play the game enough times to make use of this positive expectancy in the long run. I do not think this was demonstrated and it was not clear if 40% of initial amount or 40% of current balance is used. If one was to play this game, common sense should have triggered and said: 'Hey,...
Ignored

You are correct, as long as you can stop down the path you are currently on and start again, you will end up being profitable BUT that is not the rules of the system. The rules are you risk 40% of your equity to make 50%. Not just 40% of starting equity, but 40% at each step. This means there are no absorbing barriers in the system and it will be a continuous process forever.

This is where you become path-dependent and since the game goes on forever, no losers ever come back to be winners, the few remaining winners just inevitably become losers.

Again, this system isn't practical, and being practical isn't the point, the point is to highlight that you can take ONLY +EV decisions and still lose with almost absolute certainty under certain conditions (the third chart in origin post, if continued, drops continuously until only <0.00000001 of traders would end in profit, as the game goes on). Continue to play long enough, no one wins, even though the expected value of everyone's decisions is positive.

The reason is, the payoff function is non-ergodic.
Viewing the market through f(x)
 
1
  • Post #63
  • Quote
  • Jan 15, 2021 1:39pm Jan 15, 2021 1:39pm
  •  MnrComposite
  • Joined Nov 2020 | Status: Member | 68 Posts
AUDNZD finally closed...

Just holding USDJPY long. For sure though this was going to get stopped out but it's held on. Will hold over the weekend.
Viewing the market through f(x)
 
 
  • Post #64
  • Quote
  • Jan 16, 2021 5:51am Jan 16, 2021 5:51am
  •  salimc
  • | Joined Jan 2012 | Status: Trader | 1,321 Posts
Quoting MnrComposite
Disliked
Current Open Trades: {image} Everything is green minus EUR/USD short. That has been consolidating quite a bit. It's still a great short here with a roughly 40% probability of reaching the TP before the SL. You can do the math on the current RR offered by the market to see if that decision makes sense or not.
Ignored
Hi,
Please upload your trading charts with entry and exit marked so that newcomers can learn something. Thanks.
 
 
  • Post #65
  • Quote
  • Jan 17, 2021 2:55am Jan 17, 2021 2:55am
  •  tzamo
  • Joined Nov 2017 | Status: Member | 716 Posts
Quoting MnrComposite
Disliked
{quote} You are correct, as long as you can stop down the path you are currently on and start again, you will end up being profitable BUT that is not the rules of the system. The rules are you risk 40% of your equity to make 50%. Not just 40% of starting equity, but 40% at each step. This means there are no absorbing barriers in the system and it will be a continuous process forever. This is where you become path-dependent and since the game goes on forever, no losers ever come back to be winners, the few remaining winners just inevitably become...
Ignored
Yeah that is interesting. Are you able to repeat those 3 charts please, but instead cutting the risk by a factor of 10? eg. 5% gain vs a -4% loss, the ratio is still the same RRR of 1.25... The system described for risking 40% each step would struggle to get beyond 500 trades/ steps before failing.... Therefore it may give reason that such a system should have a negative expectancy (at these risk % values eg >30%??) due to some other variables we over-look and may not come into play when x% of initial is risked or lower risk % per step...
"Only you can Make the Future you will be proud to be a part of..." -Me
 
 
  • Post #66
  • Quote
  • Jan 18, 2021 5:57am Jan 18, 2021 5:57am
  •  Wahabafeez
  • | Joined Oct 2018 | Status: Member | 16 Posts
Quoting MnrComposite
Disliked
{quote} You are correct, as long as you can stop down the path you are currently on and start again, you will end up being profitable BUT that is not the rules of the system. The rules are you risk 40% of your equity to make 50%. Not just 40% of starting equity, but 40% at each step. This means there are no absorbing barriers in the system and it will be a continuous process forever. This is where you become path-dependent and since the game goes on forever, no losers ever come back to be winners, the few remaining winners just inevitably become...
Ignored
Please explain your system with more pictures so that we the novice will understand better
 
 
  • Post #67
  • Quote
  • Jan 18, 2021 11:40pm Jan 18, 2021 11:40pm
  •  MnrComposite
  • Joined Nov 2020 | Status: Member | 68 Posts
Some 200 MA stats to consider.

GBPUSD, 1 hr chart, last 5000 bars.

Each swing (swing being price closing above or below MA) on average moves 181 or more pips from its starting point (close)... BUT only 11% of swings are actually equal to or greater than 181 pips.

What do yall think are the implications of a stat like this?
Viewing the market through f(x)
 
 
  • Post #68
  • Quote
  • Jan 18, 2021 11:44pm Jan 18, 2021 11:44pm
  •  MnrComposite
  • Joined Nov 2020 | Status: Member | 68 Posts
Quoting tzamo
Disliked
{quote} Yeah that is interesting. Are you able to repeat those 3 charts please, but instead cutting the risk by a factor of 10? eg. 5% gain vs a -4% loss, the ratio is still the same RRR of 1.25... The system described for risking 40% each step would struggle to get beyond 500 trades/ steps before failing.... Therefore it may give reason that such a system should have a negative expectancy (at these risk % values eg >30%??) due to some other variables we over-look and may not come into play when x% of initial is risked or lower risk % per step...
Ignored
So if the risk factor is cut the system works. The system is broken essentially because it goes beyond the kelly criterion max bet value. The math for kelly bet is basically the same for this.

I do want to explore more on why the max value bet levels are where they are. I suspect it has to do with how the % required to make up DD is always larger than DD itself, so once that ratio gets to a certain point (probably based on RR), it breaks. I would be intrigued to see how this line looks across RR's 10:1-1:10.
Viewing the market through f(x)
 
 
  • Post #69
  • Quote
  • Jan 19, 2021 5:45am Jan 19, 2021 5:45am
  •  Leonard97
  • | Joined Jun 2018 | Status: Junior Member | 1 Post
Attached Image (click to enlarge)
Click to Enlarge

Name: Immagine.png
Size: 56 KB
Hi, I like your trading style so I wanted to learn something about it and now I'm in the demo mode to see if I can handle it. Is this entry correct? Did you entered as well? Thank you so much for the feedback and for anything you already did and shared with us
 
 
  • Post #70
  • Quote
  • Jan 20, 2021 7:35am Jan 20, 2021 7:35am
  •  bvdnbroe
  • | Joined May 2020 | Status: Member | 11 Posts
I am doing something similar as this strat but on M15. But also with 'same' rules and the use of 200 SMA. You ever tried it on other timeframe than 1H MnrComposite?
 
 
  • Post #71
  • Quote
  • Jan 21, 2021 12:57am Jan 21, 2021 12:57am
  •  pakeha
  • | Joined Sep 2011 | Status: Member | 410 Posts
Quoting MnrComposite
Disliked
EURUSD looks to be heading for the stop. Very likely to get stopped out. We are setting up to watch a great development for our next entry though. {image} You can see that we are below the 200 MA and have recently made a nice lower low around 1.2130. We are currently in a pullback heading back towards the MA. We will want to watch here for a new lower high to be formed, and once price starts consolidating around here and turning back down, we will look to short again. You want to picture this playing out before it does, so if/when it does, it's...
Ignored
MnrComposite, I think I understand what you are trying to do. However, as an FYI the Jan 13, 2021, lower high on the EURUSD chart isn't confirmed until price breaks the previous lower low (i.e. 1.2330 on Jan 11). So in the case of a sell, it appears like you are looking for price to retrace toward the 200MA, and then entering a trade 20-40 pips below a fractal high (i.e. Jan 13, 2021 at 1.2223). Is that correct?
 
1
  • Post #72
  • Quote
  • Jan 24, 2021 9:40am Jan 24, 2021 9:40am
  •  Tylerz
  • | Joined Dec 2017 | Status: Member | 98 Posts
Quoting MnrComposite
Disliked
{quote} So if the risk factor is cut the system works. The system is broken essentially because it goes beyond the kelly criterion max bet value. The math for kelly bet is basically the same for this. I do want to explore more on why the max value bet levels are where they are. I suspect it has to do with how the % required to make up DD is always larger than DD itself, so once that ratio gets to a certain point (probably based on RR), it breaks. I would be intrigued to see how this line looks across RR's 10:1-1:10.
Ignored
it was a very promising thread. the start of this topic was interesting and i am sad to see that this thread is already finished.

I thought that we can learn.a new sentse method, but in this way it was nothing.
 
 
  • Post #73
  • Quote
  • Jan 24, 2021 1:24pm Jan 24, 2021 1:24pm
  •  calaxcorp
  • | Joined Feb 2014 | Status: Member | 64 Posts
Quoting MnrComposite
Disliked
{quote} So if the risk factor is cut the system works. The system is broken essentially because it goes beyond the kelly criterion max bet value. The math for kelly bet is basically the same for this. I do want to explore more on why the max value bet levels are where they are. I suspect it has to do with how the % required to make up DD is always larger than DD itself, so once that ratio gets to a certain point (probably based on RR), it breaks. I would be intrigued to see how this line looks across RR's 10:1-1:10.
Ignored
MnrComposite:
Thanks for demonstrating your 50-50 experiment in Post 52 -- by betting 40% of account balance to gain 50% of account balance if win... and you showed even with the +ve expectancy of the strategy, the account would likely dwindle towards zero after many trades.

I did an excel analysis. It shows if the amount to bet is lowered to 33.33333% of the account balance, the account balance would tend to stay at about breakeven after many runs. If the bet size is lower than that, then it would seem to provide a growth path for the account equity.

So if we can control the bet (risk) size while maintaining a 50-50 probability, we may have a good chance.
Thanks.
~Bill
 
 
  • Post #74
  • Quote
  • Feb 10, 2021 6:09pm Feb 10, 2021 6:09pm
  •  skyline555
  • | Joined Sep 2015 | Status: Member | 77 Posts
Sorry but why you buy usd/cad and usd/jpy?
 
 
  • Post #75
  • Quote
  • Feb 13, 2021 7:02am Feb 13, 2021 7:02am
  •  skyline555
  • | Joined Sep 2015 | Status: Member | 77 Posts
Basic Trading Rules:
1. Only Trade in Direction of MA. This will ensure that when trends occur, we are a part of them. That being said, we don't necessarily need the market to be trending in order to trade it.

why you sell aud nzd?
 
 
  • Post #76
  • Quote
  • Feb 13, 2021 8:11am Feb 13, 2021 8:11am
  •  skyline555
  • | Joined Sep 2015 | Status: Member | 77 Posts
I don't know how you make so much money with this system
 
 
  • Post #77
  • Quote
  • Feb 13, 2021 8:20am Feb 13, 2021 8:20am
  •  skyline555
  • | Joined Sep 2015 | Status: Member | 77 Posts
Quoting skyline555
Disliked
I don't know how you make so much money with this system
Ignored
Sorry bur i don't figure that
 
 
  • Post #78
  • Quote
  • Last Post: Apr 20, 2021 6:34am Apr 20, 2021 6:34am
  •  Wags
  • Joined Aug 2017 | Status: Member | 1,609 Posts
Quoting MnrComposite
Disliked
Some 200 MA stats to consider. GBPUSD, 1 hr chart, last 5000 bars. Each swing (swing being price closing above or below MA) on average moves 181 or more pips from its starting point (close)... BUT only 11% of swings are actually equal to or greater than 181 pips. What do yall think are the implications of a stat like this?
Ignored

Do you mean a swing being a reversal below and above the 200ma?

It would be a more impressive post/stat if you gave your thoughts on what the implications would be
On Point All Time Return: na
 
 
  • Recycle Bin
  • /
  • (binned per thread starter’s request) 200MA f(x) Trading
  • Reply to Thread
    • 1 23 Page 4
    • 1 23 Page 4
0 traders viewing now
Top of Page
  • Facebook
  • Twitter
About FF
  • Mission
  • Products
  • User Guide
  • Media Kit
  • Blog
  • Contact
FF Products
  • Forums
  • Trades
  • Calendar
  • News
  • Market
  • Brokers
  • Trade Explorer
FF Website
  • Homepage
  • Search
  • Members
  • Report a Bug
Follow FF
  • Facebook
  • Twitter

FF Sister Sites:

  • Metals Mine
  • Energy EXCH
  • Crypto Craft

Forex Factory® is a brand of Fair Economy, Inc.

Terms of Service / ©2022