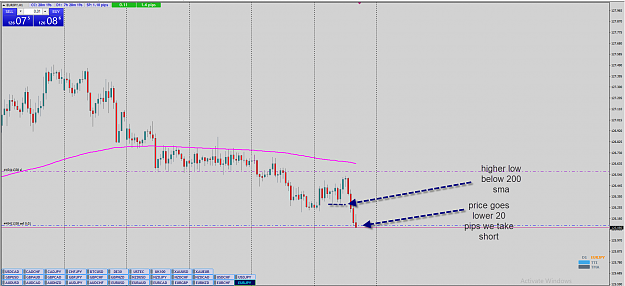
Yes that looks like money to me. Forgive my mixing of terms, since we are below MA, we want a lower high, which comes just after your horizontal line. Selling 20-40 pips from that peak looking 1:4 to 1:1.5 RR (depending on where in the 20-40 pip range you are in) is a good entry imo.
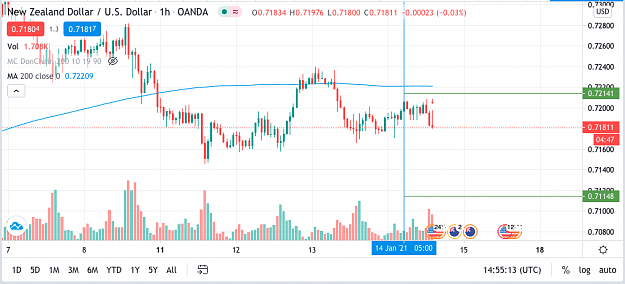
Once spreads tighten again after the close will be looking to get short NZDUSD. Set up looks really nice... {image} Need to free up some margin though so we will see...
Ignored
CADCHF hit TP so I finally freed up some margin. NZDUSD still looking pretty ripe. Shorting here. Probabilities suggest we have about a 40-50% probability of profit with this one. Time will tell though!
Attached Image (click to enlarge)
Can almost see the 3rd leg of what most would call a 123 pattern getting ready to form. Shorting the pullback rollover with the trend is always a decent bet!
{quote} Yes that looks like money to me. Forgive my mixing of terms, since we are below MA, we want a lower high, which comes just after your horizontal line. Selling 20-40 pips from that peak looking 1:4 to 1:1.5 RR (depending on where in the 20-40 pip range you are in) is a good entry imo. I am in that same short. {image}
Ignored
How do you determine the SL for your trade? Seems to be at / near the 200 MA line, correct?
{quote} How do you determine the SL for your trade? Seems to be at / near the 200 MA line, correct?
Ignored
It will end up being near the 200 MA line but basically, you want it above the swing high. I personally do 10 pips above the close of the marked candle in the image and you will see why later when we go into the data, but again, it works out to be basically above the swing high + some extra.
I suspect that in nine years man can create a more complex system that this, but if it brings him money then he will have no motivation to share it.Am I right?
{quote} CADCHF hit TP so I finally freed up some margin. NZDUSD still looking pretty ripe. Shorting here. Probabilities suggest we have about a 40-50% probability of profit with this one. Time will tell though! {image} Can almost see the 3rd leg of what most would call a 123 pattern getting ready to form. Shorting the pullback rollover with the trend is always a decent bet!
When you first look at a price chart, you see that we are watching price evolve over 2 axes, price and time.
And as you watch the price trade, it appears that these 2 axes are linked and are moving together.
But… are they really?
When you step back and think about it, you will find that the 2 axes are completely different, in terms of their drivers.
The time axis moves along at whatever constant rate you arbitrarily selected while the price access is entirely driven by actual orders trading over the bid-ask spread.
For some, it seems trivial but it begs the question, do these differences have implications that we need to be aware of?
Yes, they do, especially in terms of gathering market statistics that you plan to trade on.
The biggest implication is, this means the process of trading can be considered non-ergodic under certain circumstances.
This means that what we measure in space, can be completely devoid from what we actually will most likely observe in time.
Something can be considered ergodic if the time average of an individual observation equals the average of the ensemble of observations.
An Example of Non-Ergodicity
Let’s consider we have a trading strategy that has a 50% win rate, but we must risk 40% of our account in order to make 50% on every trade.
Would you trade this system?
Let’s see, playing this game should net us a positive expected value of +5% of our equity for each trade.
EV% = (.5 * .5) – (.5 * .4) = 0.05
So mathematically, yes this game makes sense to play, and we should play as often as we can since we can expect to make a 5% return for each round we play, on average.
Unfortunately, the payoff, exposure of f(x) is actually non-ergodic, meaning that, even though this game makes perfect sense on paper, in space, it falls apart in time, and one will actually almost never see a profit all if they keep playing.
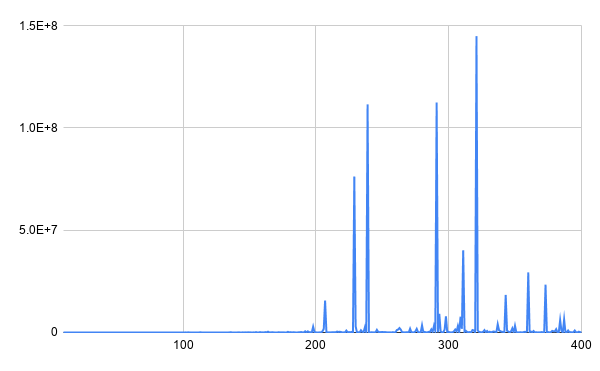
To demonstrate this, I have simulated playing this game for x rounds, 10000 times. x increases by 1 so we can tease out the variance to see what the payoff looks like if we were to play more than x rounds.
The first chart demonstrates what we are likely to see on average as a return, playing x rounds on the horizontal axis. This is what we should see in terms of measuring space.
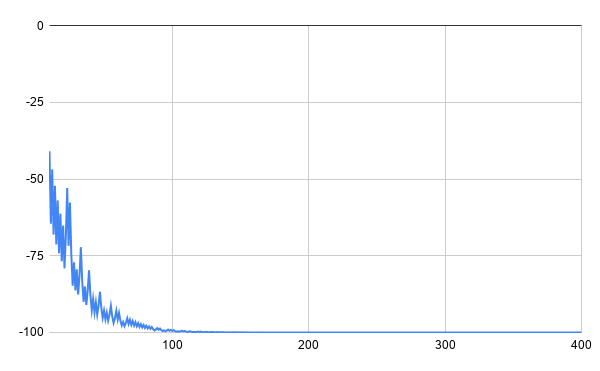
The second chart demonstrates what we actually are most likely to see on average as a return playing x rounds.
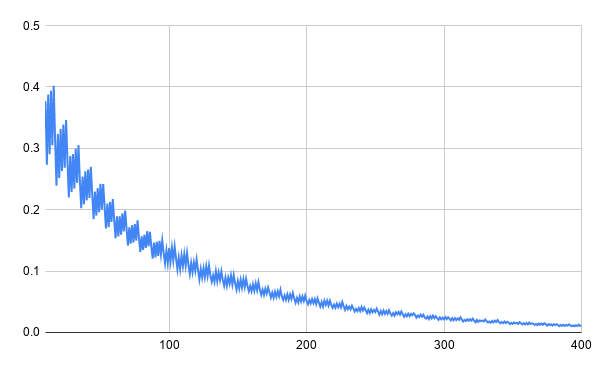
The third chart is the probability of you observing a return that is closer to the space average, vs the time average. You can see that if you play long enough, almost no one makes money and the very few who do, make it all.
Attached Image
Attached Image
Attached Image
If this doesn't blow your mind you should. How could a system that yields a positive expected value of 5% per trade, lose almost 99% of the time over the long haul?
Because the process is non-ergodic and the likelihood of actually winning based on the probability of you stepping down a positive path or a negative one.
The catch is, once you are on that path, you can't ever get off it.
The losers never come back to be winners, the number of winners just gets smaller and smaller.
Making decisions based entirely on space measurements, with no regard to their time counterparts, is one of the deadliest things you can do.
{quote} Spiked. USDJPY will likely stop soon. When margin is free may long some GBPJPY...
Ignored
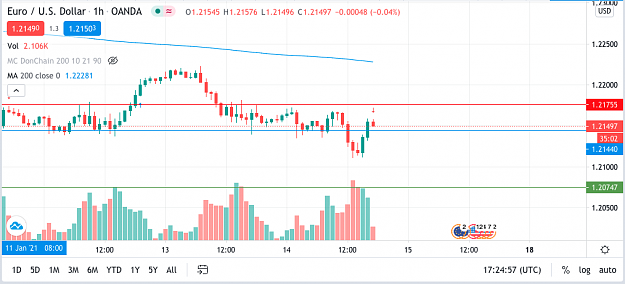
I was going to ask you about that EURUSD trade - shouldn't you wait for confirmation candle before you take the trade? I mean from the chart at that time, there is no way to know if the pullback has ended.
Right now, the 1 PM candle looks nice and red with long wick at the top so that is a better rejection/confirmation I would think.
Space, Time & Ergodicity When you first look at a price chart, you see that we are watching price evolve over 2 axes, price and time. And as you watch the price trade, it appears that these 2 axes are linked and are moving together. But… are they really? When you step back and think about it, you will find that the 2 axes are completely different, in terms of their drivers. The time axis moves along at whatever constant rate you arbitrarily selected while the price access is entirely driven by actual orders trading over the bid-ask spread. For some,...
Ignored
Uhh. I understand some things in your comment. Could write this in normal people lamguage?
( 0.5-0.5)? what is first 0.5 ? and second 0.5?
(0.5-0.4) what is 0.5?
{quote} Uhh. I understand some things in your comment. Could write this in normal people lamguage? ( 0.5-0.5)? what is first 0.5 ? and second 0.5? (0.5-0.4) what is 0.5? and what is the most o important in this comment?
Ignored
.25-.2=0.05
You have an expected value of 5% because you have a 50% chance of making 50% minus a 50% chance of making 40%.
Ive seen charts here with volume being used on FX pairs? There is NO centralized trading desk in forex so the only volume you get is from YOUR brokers volume.
Ive seen charts here with volume being used on FX pairs? There is NO centralized trading desk in forex so the only volume you get is from YOUR brokers volume.
Ignored
Volume per tick is valid in the fx and is used in the VSA.
{quote} It will end up being near the 200 MA line but basically, you want it above the swing high. I personally do 10 pips above the close of the marked candle in the image and you will see why later when we go into the data, but again, it works out to be basically above the swing high + some extra.
Ignored
I like the average of 200 on the H1 chart, I also use the average of 50 which is equivalent to the average of 200 on the M15, if you are close to it I hope to know if you are going to reject or go through it.
And the average of 20 is 200 on the M5.
{quote} Could write this in normal people lamguage? ( 0.5-0.5)? what is first 0.5 ? and second 0.5? (0.5-0.4) what is 0.5?
Ignored
Tyler, I think you quoted the formula incorrectly. It should be EV% = (.5 * .5) – (.5 * .4).
The first .5 is the probability of winning in an event.
The second .5 is what we get when we win.
The third .5 is the probability of losing.
The .4 is what we give up when we lose.
So the Expected Value is (the probability of winning X What we get when we win) minus (the probability of losing X what we give up when we lose).