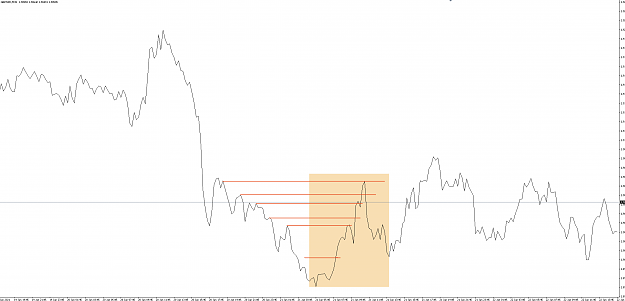
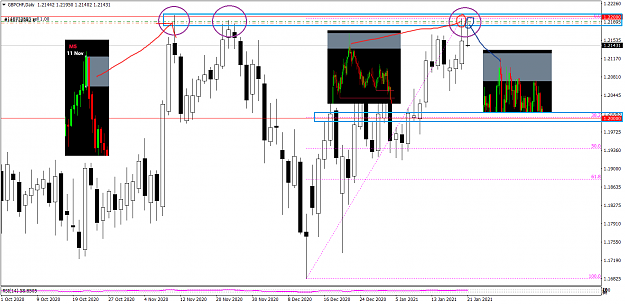
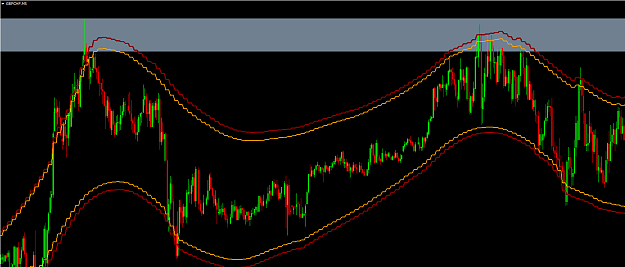
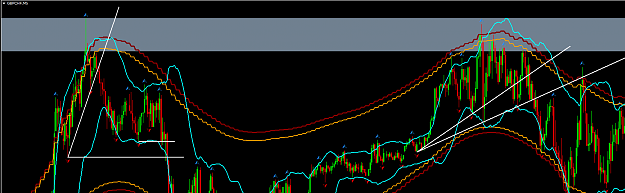
In line with being persistent and consistent, I'd like to share a couple of visuals that I find useful to indicate time over price and price over time.
As time decays or 'runs down on the clock', in certain context of viewing this, probabilities goes up.
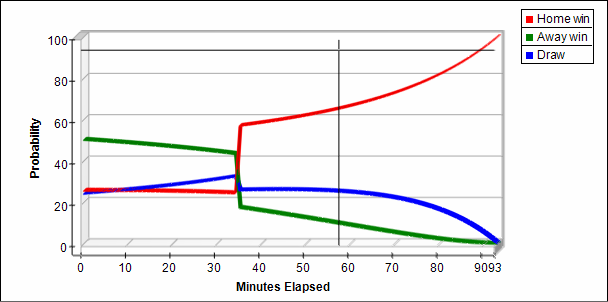
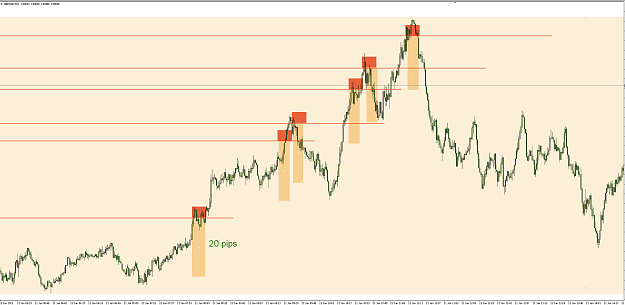
Think of Home or Away wins as Rally up or Sell off. And Draw as continue to go sideways. Probability once Time has elapsed and been spent.
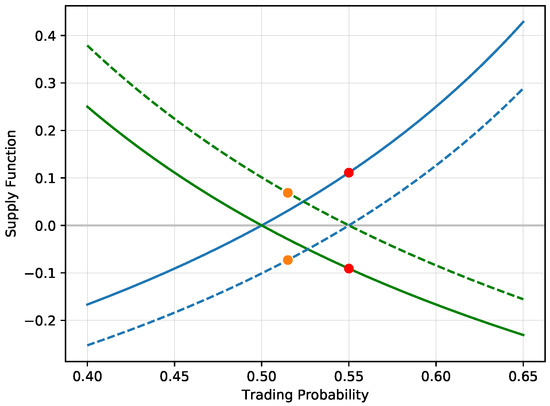
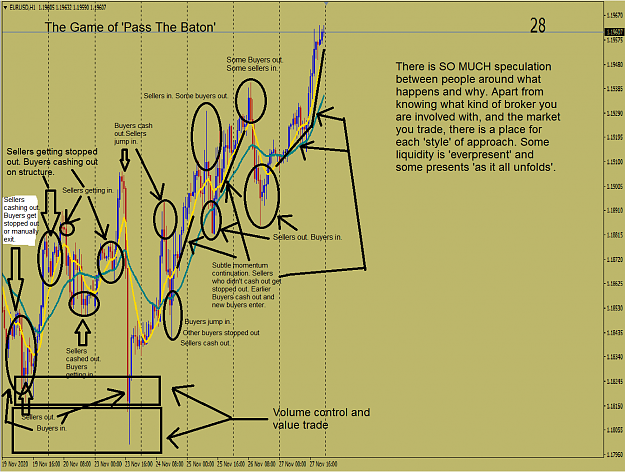
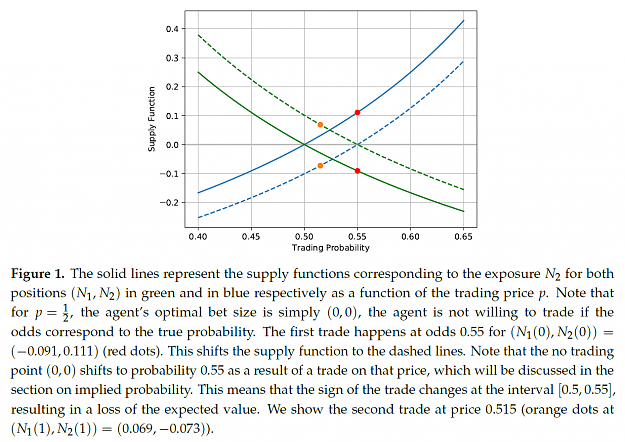
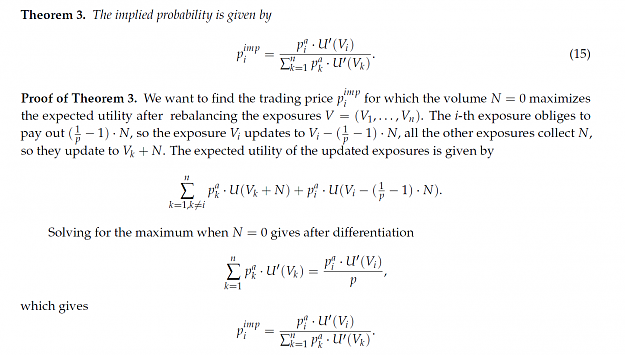
Supply Function and Trading Probability. Firstly, FORGET about Supply and Demand, Support and Resistance and all the other anecdotal abstract ideas here. THIS pic CAN give you the trader, great insight into ......
- Buyer enters the market
- Buyer cashes out either at a predetermined automatic TP target or manually closes the order while in profit
- Buyer gets stopped out at a predetermined price
- Buyer manually closes out the order at a loss
- Buyer is margin stopped. This is where the floating temporary loss currently in play due to their order in the market, exceeds the account's manageable limits - can be determined by the trader but more than likely preset by the broker.
- Seller enters the market
- Seller cashes out either at a predetermined automatic TP target or manually closes the order while in profit
- Seller gets stopped out at a predetermined price
- Seller manually closes out the order at a loss
- Seller is margin stopped. This is where the floating temporary loss currently in play due to their order in the market, exceeds the account's manageable limits - can be determined by the trader but more than likely preset by the broker.
With this predeterministic information, if you're being objective then it will become more clear of the why when where how who.
Peter
As time decays or 'runs down on the clock', in certain context of viewing this, probabilities goes up.
Attached Image
Think of Home or Away wins as Rally up or Sell off. And Draw as continue to go sideways. Probability once Time has elapsed and been spent.
Attached Image
Supply Function and Trading Probability. Firstly, FORGET about Supply and Demand, Support and Resistance and all the other anecdotal abstract ideas here. THIS pic CAN give you the trader, great insight into ......
- Buyer enters the market
- Buyer cashes out either at a predetermined automatic TP target or manually closes the order while in profit
- Buyer gets stopped out at a predetermined price
- Buyer manually closes out the order at a loss
- Buyer is margin stopped. This is where the floating temporary loss currently in play due to their order in the market, exceeds the account's manageable limits - can be determined by the trader but more than likely preset by the broker.
- Seller enters the market
- Seller cashes out either at a predetermined automatic TP target or manually closes the order while in profit
- Seller gets stopped out at a predetermined price
- Seller manually closes out the order at a loss
- Seller is margin stopped. This is where the floating temporary loss currently in play due to their order in the market, exceeds the account's manageable limits - can be determined by the trader but more than likely preset by the broker.
With this predeterministic information, if you're being objective then it will become more clear of the why when where how who.
Peter
Real Trading is not gambling.
1