{quote} I hate to ask this question. Feeling a little dumb because I don't understand. What does "Behind previous entry mean"?? Can somebody explain in other words??
Ignored
"Being behind" means that the Open price of current daily bar is below last entry in Buy trades OR above last entry in Sell trades.
Long: Open(0) < last entry
Short: Open(0) > last entry
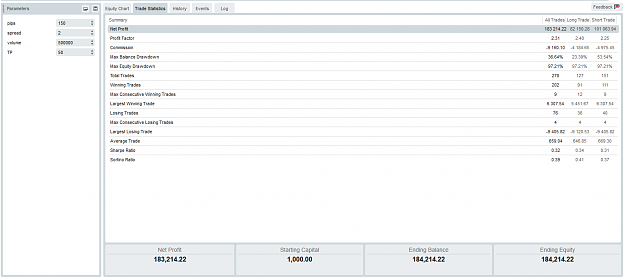
{quote} This graph of profit and loss does not reflect DOS trades at all. How come you close trades in a loss, in which they are not part of a basket? It they were in a basket you would not get a decreasing graph without gaining similar profit on the same time.
Ignored
Sorry smile89 if I contaminations your thread
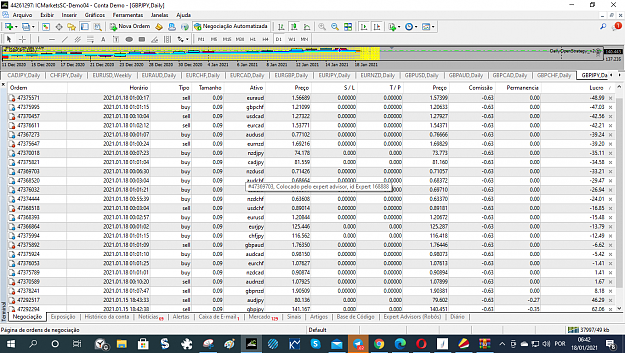
I trade all major and minor and when the basket hit 2% other EA close win and loss. This week I get 2% * 5 = 10 % account profit
{quote} Sorry smile89 if I contaminations your thread I trade all major and minor and when the basket hit 2% other EA close win and loss. This week I get 2% * 5 = 10 % account profit
Ignored
This method that you explain is not reflected in the graph either.
It shows different times of closing trades and it does not show steady profit of 2% as well.
Hi, I'm new here. I am confused about where to start. Does the first page already have complete trading instructions? Does it have an expert advisor? If yes, where can I download it?
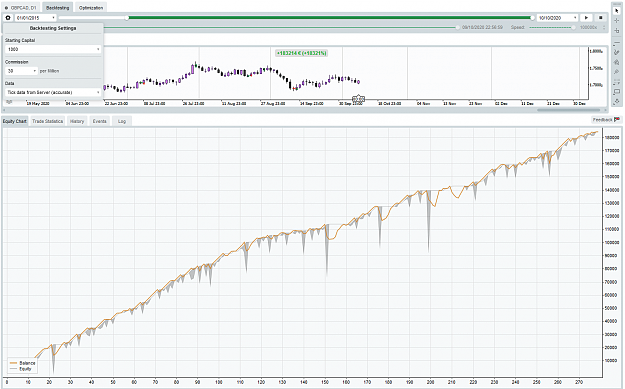
A little discussion about DrawDown (DD). The graph from post 97 is a fine example, so I copy it here.
According to the author then DD is 97% - close to blowing the account.
No way - not even close if you use normal money management. Of cause if you trade every penny on the account in one trade, then you are close to be broke - but you don't do that. If you trade 5% of the account then you can see at the graph, that the DD is temporary and the gain is coming when the positions are sold. That is a strength of this strategy.
Also i presume that the testing is made by using the same lot size during the whole time. This means that when you have built up some gain, then there is basis for a trade having DD on more than 100% without blowing the account, because you have lots of gained capital to support the temporary loss.
Only when an equity loss spike downwards and hit the 0 on the Y-axis, then your money are lost. Then again - only if you trade all the money there is at the account, otherwise there will be support to a temporary equity loss on more than 100%, so that the gain can be taken afterwards.
Take a closer look at the graph. Trade #22 is getting close to zero at a temporary loss. Even if it hit zero, then your account can support the temporary loss, because you only trade 5 %. The rest of the equity losses thruout the graph are not dangerous to the account in any way.
Trade #22 is getting close to zero at a temporary loss. Even if it hit zero, then your account can support the temporary loss, because you only trade 5 %. The rest of the equity losses thruout the graph are not dangerous to the account in any way. This is important to understand
Ignored
Understood. But if only 5% of the account is used, then why not increase the initial deposit in the expert properties? In the example above the test starts with 10.000. If these equal 5%, then why not put 200.000 as initial deposit? Then also the % calculation of DD and win would be closer to the truth
The 5% is what I suggest to use on a trade but it very much depend on the DD of the actual strategy. Read the example as if the trader used 100% of the account.
My message is, that temporary large draw downs on the DOS strategy are not that dangerous if you use proper money management. Then the 10.000 would be 5% of an account of 200.000 and there is a very long way to blow the account.
hi RF, Mr Smilee recommends 0.15 lot per 10k and if I understand you correctly, you propose 0.05 lot per 10k......
now you can`t trade correlated pairs - not GA and GN and GJ and GU etc at the same time, so not many trades - and your profit per year will be minimal.
Hello everyone,
I created an indicator for mt4, so we can see the "big" bars over 110pips.. only difference with the one in original post, are arrows are opposite side.
so for example if a bullish "big" bar is forming, you will get an red sell arrow..
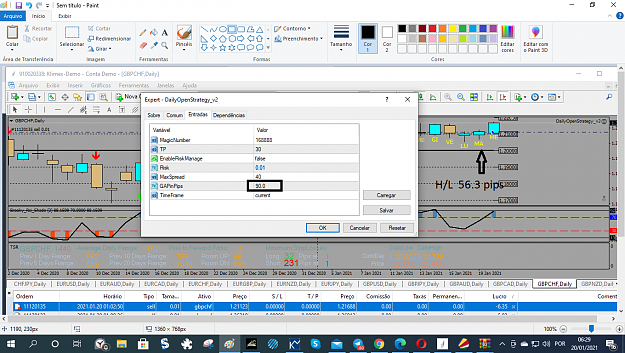
[quote = soko8; 13359111] L'ho modificato. 1. aggiungere un interruttore di rischio per abilitare o disabilitare la gestione del rischio. 2. eliminare l'indicatore ATR e utilizzare il parametro GAP. {file} {file} [/ quote]
Hi to everyone. As I told you before the EA may work perfectly if it can open correctly with the GAP indicated in the option of properties.
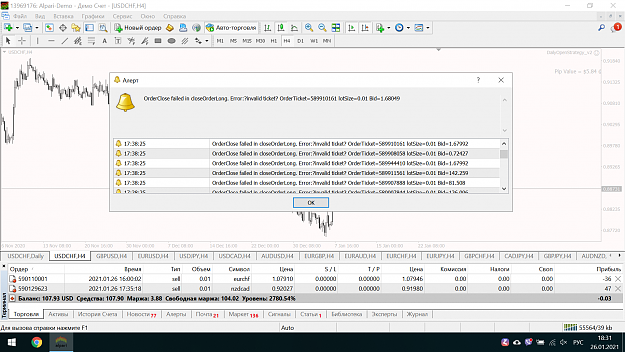
I'm also occasionally getting this error! I think it interferes with order placement. The solution I've found for now is to close the mt4 terminal and start it again. But hopefully there will be a permanent fix. PS the EA has made a nice start on my demo since the beginning of last week
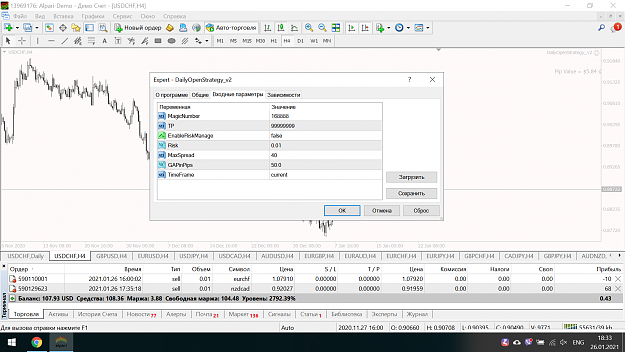
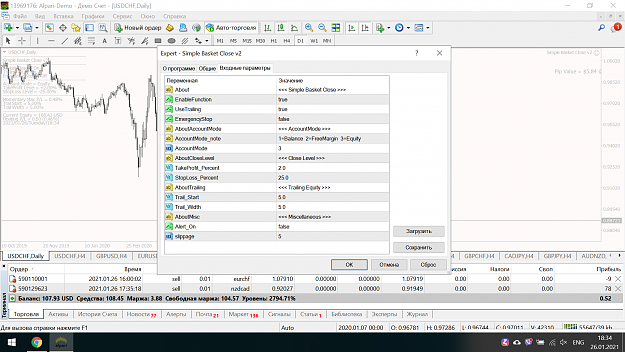
Soko8, thank you for your work! May I ask for an advice? {quote} Using this version I see this all the time: {image}Settings of DOS: {image}Settings of Basket Close: {image}How can I fix the alerts flashing?
Soko8, thank you for your work! May I ask for an advice? {quote} Using this version I see this all the time: {image}Settings of DOS: {image}Settings of Basket Close: {image}How can I fix the alerts flashing?
Ignored
I didn't consider using other EA to close the order.
If you want to do that, please remove DOS EA, then reload DOS EA.
Oh, that was it for me as well, I was using another EA to close the trades. My solution that works for me is to just close and restart the mt4 terminal, it's quicket than reloading the EA on every chart.
PS, many thanks for coding the EA soko8, it's performing well
Don't be so skeptic with this kind of strategy. It looks promising. See {image}{image}{image}
Ignored
Wanted to ask long ago, sorry if not actual.
What is this graph? I mean how do you test strategy|EA with more then one pair?
Thank you for your work! I forward test it on 4 different TFs and will share my results.