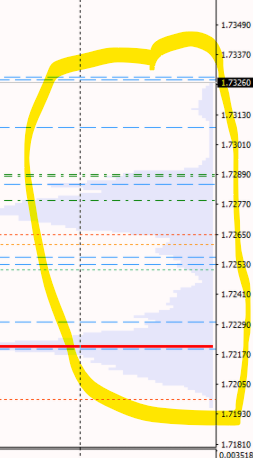
Total noob here but i've downloaded the indicator 'volume profile on timerange' which displays the volume at the right side of the chart
only to find its drawing the profile way down or up the current price? (see snippet)
When i look at Kette's charts above, the current price seems to be included in this display?
Any ideas or templates i can use to mimic the indicator like Kette does?
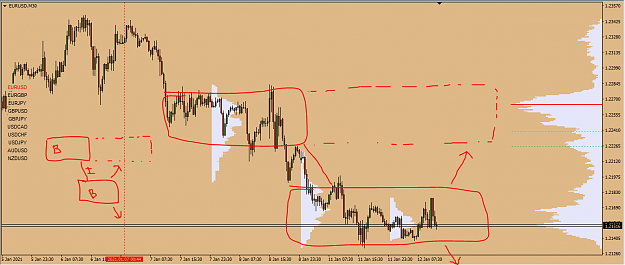
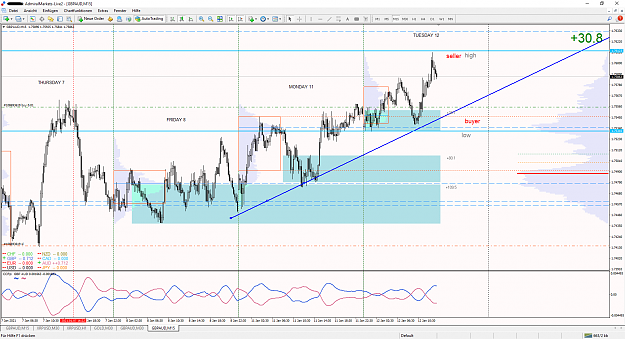
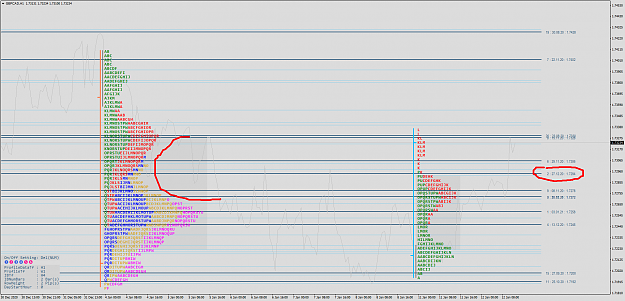
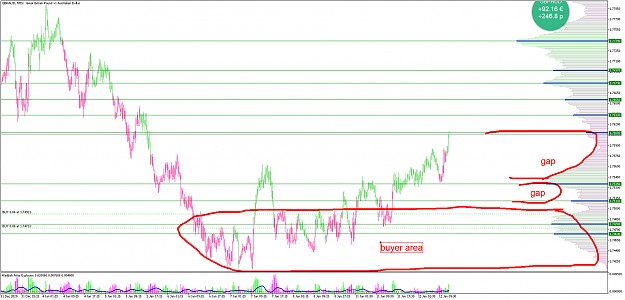
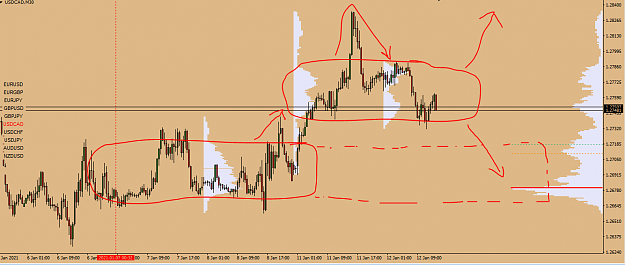
i dont trade no more with mp, but for people understand: price always seek balance look at the pictures B = balance I = imbalance cheers {image} {image}
i dont trade no more with mp, but for people understand: price always seek balance look at the pictures B = balance I = imbalance cheers {image} {image}
Ignored
Complicated facts - simply explained. Very good!
Offtopic: If you no longer trade MP, what then? And why?
{quote} Complicated facts - simply explained. Very good! Offtopic: If you no longer trade MP, what then? And why?
Ignored
i´m a grid trader and i use the concept of exhaustion, balance/imbalance,
because i´m not a sniper or a very accurate trader
and i don't have the time to be glued on the screen
cheers
Uncertainty of the market must be embraced and accepted.
i dont trade no more with mp, but for people understand: price always seek balance look at the pictures B = balance I = imbalance cheers {image} {image}
{quote} thanks for answering i get there are millons and millions to trade the same charts/templates. But what what i mean is, for example. Now in you latest post. "come from above or below" above /below what? look for gaps? do you trade towards them? through them? use them as reversalpoints? set limit orders? stoporders? how to use correlation? with the correlation indicator you show, i see almost to opposite perfect lines every time. How do you use it to spot a good trade? Again, not criticizing you. Been reading alot about you. I know...
Hi guys, Total noob here but i've downloaded the indicator 'volume profile on timerange' which displays the volume at the right side of the chart only to find its drawing the profile way down or up the current price? (see snippet) When i look at Kette's charts above, the current price seems to be included in this display? Any ideas or templates i can use to mimic the indicator like Kette does? {image}
Ignored
If you use 1 minute, go to M1 chart and drag the chart backwards because the indicator does not automatically read past ticks.
If you use 5 minutes, go to m5 and drag again, etc.
The red dotted line shows the limit of ticks the indicator can read, just drag more if you want more data.
|
Joined Apr 2020
|
Status: Lines and gaps.
|168 Posts
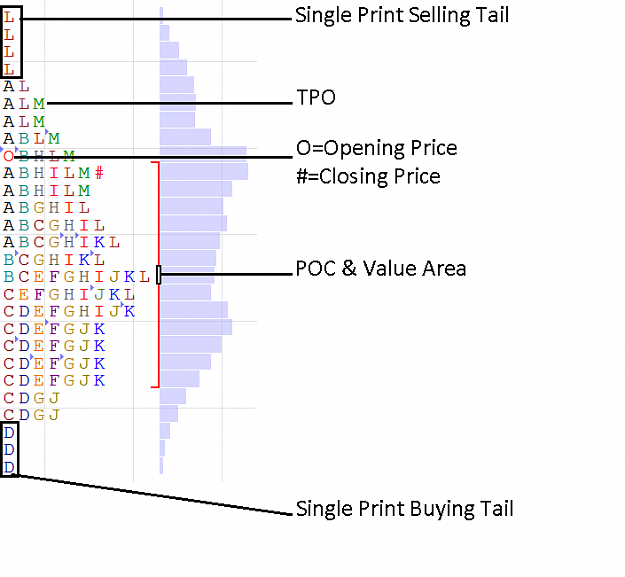
Okay people must understand the logic of market profile.
It is a logic based on a reflection of everyday markets. Buy low, sell high. You can literally see the graphics of a premium or discounted market.
To simplify things:
VAH = VALUE AREA HIGH = The value is already high so naturally you will sell here.
POC = Market is balanced, meaning buyers and sellers agree that the price here is fair for them both. There are some strategies you can play here if you study more.
VAL = VALUE AREA LOW = The value is already low so naturally you will buy here.
Now the question, we are at VAH but price breaks out from there. This will give you insights on the confidence of OTF (other time frame traders) because originally PIT traders are DAY TRADERS and when the price is already at VAH and it broke out, they know investors/positional traders sees the market as undervalued or cheap and there will be a bull run or the like.
I did not add other elements to simplify the idea.
I will add more to help build the logic behind this.
{quote} If you use 1 minute, go to M1 chart and drag the chart backwards because the indicator does not automatically read past ticks. If you use 5 minutes, go to m5 and drag again, etc. The red dotted line shows the limit of ticks the indicator can read, just drag more if you want more data.
Ignored
You can always just do the maths as well and enter it as past minutes
{quote} You can always just do the maths as well and enter it as past minutes 1 Day = 1440 5 Days = 7200
Ignored
Yes, however, even if you choose 5 days but the red dotted line only reaches on the past 3rd day (only reads 3 days of tick data), the volume profile is incomplete.