• Home
  • Forums
  • Trades
  • News
  • Calendar
  • Market
  • Brokers
  • Login
  • Join
  • User/Email: Password:
  • 7:34am
Menu
  • Forums
  • Trades
  • News
  • Calendar
  • Market
  • Brokers
  • Login
  • Join
  • 7:34am
Sister Sites
  • Metals Mine
  • Energy EXCH
  • Crypto Craft

Options

Bookmark Thread

First Page First Unread Last Page Last Post

Print Thread

Similar Threads

Dow futures point to more than a 1,000-point fall at the open 1 reply

Point and figure charts 7 replies

Pivot point reference point? 7 replies

where is vantage point software available 2 replies

  • Trading Systems
  • /
  • Reply to Thread
  • Subscribe
  • 3,325
Attachments: On Point
Exit Attachments

On Point

  • Last Post
  •  
  • Page 1 23456 216
  • Page 1 2 216
  •  
  • Post #1
  • Quote
  • First Post: Edited Jan 5, 2021 6:06am Dec 15, 2020 8:24pm | Edited Jan 5, 2021 6:06am
  •  Wags
  • Joined Aug 2017 | Status: Member | 1,609 Posts
I have abandoned the past data indi approach to trading as it is not what i am looking for, when i say past data i mean any indi that looks back to calculate the future in an averaging kind of way, which nearly all other indicators are based on.

So this thread is based on Volume profile and point of control , i may add OBV to this at a later date but would prefer to have a cumulative delta indi for MT4 which calculates from market open each day.

I know this is tick volume and not real volume so please do not tell me this on the thread.

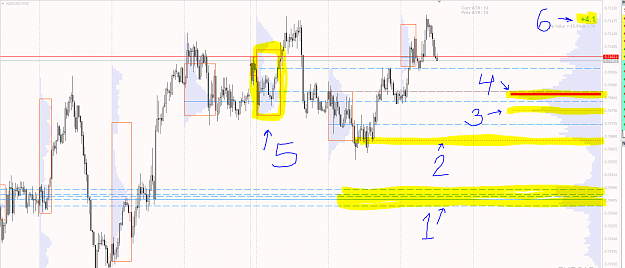
I have been reading up on and testing volume profile for quite a few months now and have came up with my own system for trading it, what i like about this is you can really get in at the best possible price we do not wait for close of candle blah blah blah we enter when price hits our target area no matter what time of the day and if it goes against us the risk is small depending on previous day profile ( thats something else we can discuss ).

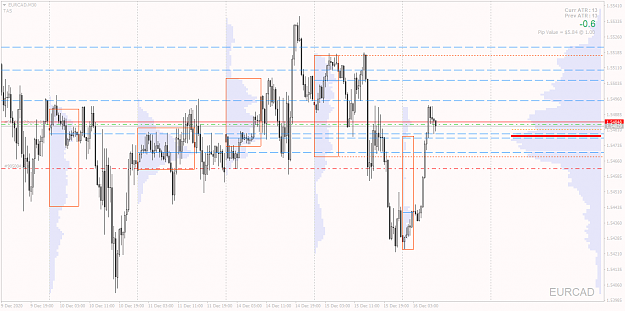
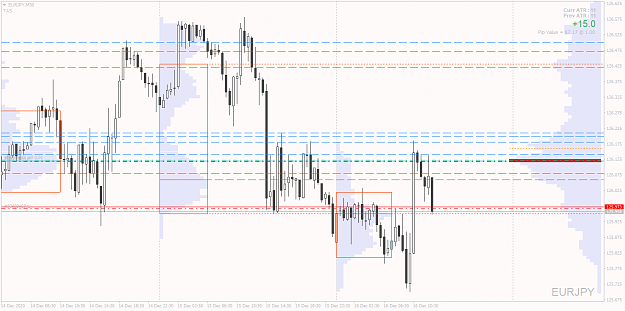
I use 30 minute charts on MT4 platform and use 2 types of volume profile - daily profile and profile by time.

Daily profile is set to look back 11 days so that gives me 10 completed and the open day, it gives me all the POC's from those previous 10 days, also i get the previous day VAH and VAL as lines in a different colour.

My volume profile by time is set to look back 6 days 8640 1 minute bars.

I look for retracement to strong S/R zones to enter created from all POC's and exit if break reaches previous day VAH or VAL respective, TP is next POC if profile is really strong or if weak i move SL to where i want to be
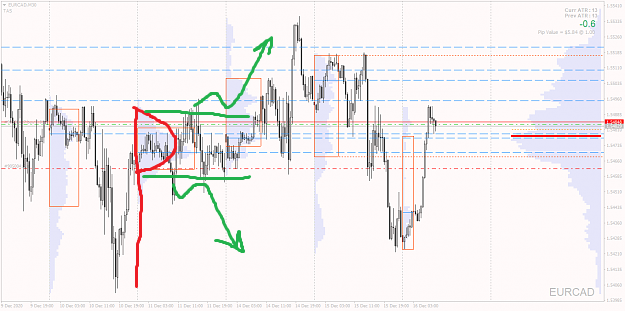
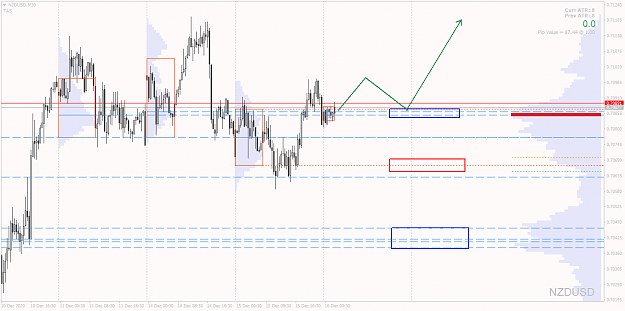
Example:

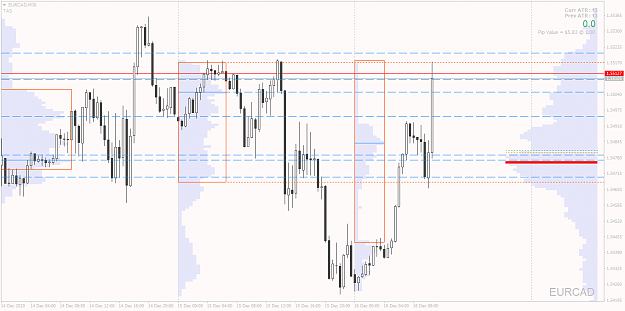
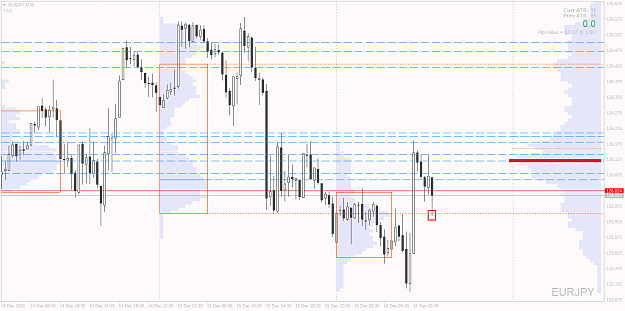
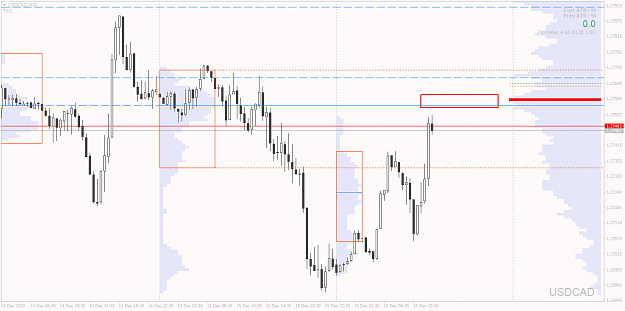
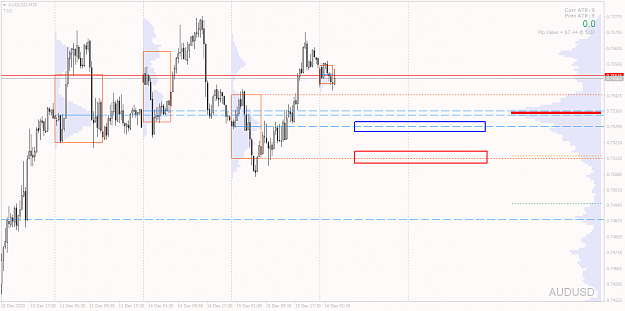
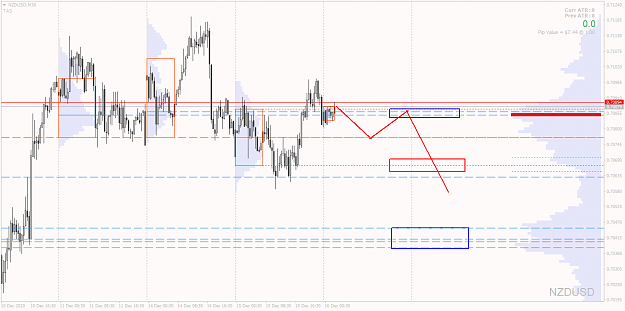
Blue areas are potential entries and red rectangle would be worst case exit or TP, we need to have a decent move either way before retrace.

Attached Image (click to enlarge)
Click to Enlarge

Name: NZDUSDM30.png
Size: 48 KB


or

Attached Image (click to enlarge)
Click to Enlarge

Name: NZDUSDM30-sell.png
Size: 48 KB

There is far more to this than i have just said but we can talk about that as we move along, if you want to join in.

Be back soon

Attached File
File Type: mq4 #3 News Panel (White).mq4   51 KB | 1 download | Uploaded Jan 5, 2021 6:06am

Attached File
File Type: mq4 ACP Arrow Change Pair.mq4   28 KB | 1 download | Uploaded Jan 5, 2021 6:06am

Attached File
File Type: mq4 ACP Multi Pair.mq4   2 KB | 1 download | Uploaded Jan 5, 2021 6:06am

Attached File
File Type: mq4 atr-chart-labeled.mq4   6 KB | 1 download | Uploaded Jan 5, 2021 6:06am

Attached File
File Type: mq4 Volume profile on time range.mq4   83 KB | 1 download | Uploaded Jan 5, 2021 6:06am

Attached File
File Type: ex4 MarketProfile_v1.16_POC_Heatmap.ex4   124 KB | 1 download | Uploaded Jan 5, 2021 6:06am

Attached File
File Type: tpl OnPoint.tpl   553 KB | 1 download | Uploaded Jan 5, 2021 6:06am
On Point All Time Return: -53.3%
  • Post #2
  • Quote
  • Dec 15, 2020 9:16pm Dec 15, 2020 9:16pm
  •  Wags
  • Joined Aug 2017 | Status: Member | 1,609 Posts
Would be looking to buy around the blue rectangle and risk at red rectangle

Attached Image (click to enlarge)
Click to Enlarge

Name: AUDUSDM30.png
Size: 45 KB
On Point All Time Return: -53.3%
 
3
  • Post #3
  • Quote
  • Edited at 3:15am Dec 16, 2020 2:10am | Edited at 3:15am
  •  Wags
  • Joined Aug 2017 | Status: Member | 1,609 Posts
Long on EC will move to breakeven at next POC line and so on

20 pip SL as yesterdays VAL and POC was to close and its VAH was above

Attached Image (click to enlarge)
Click to Enlarge

Name: EURCADM30.png
Size: 64 KB
On Point All Time Return: -53.3%
 
2
  • Post #4
  • Quote
  • Dec 16, 2020 2:21am Dec 16, 2020 2:21am
  •  Wags
  • Joined Aug 2017 | Status: Member | 1,609 Posts
If anyone wants a go here is Tpl and Profile indi's

Attached File
File Type: mq4 MarketProfile.mq4   218 KB | 1 download

Attached File
File Type: mq4 Volume profile on time range.mq4   83 KB | 1 download

Attached File
File Type: tpl onpoint.tpl   1.7 MB | 1 download
On Point All Time Return: -53.3%
 
3
  • Post #5
  • Quote
  • Dec 16, 2020 3:53am Dec 16, 2020 3:53am
  •  Wags
  • Joined Aug 2017 | Status: Member | 1,609 Posts
TP on EC at yesterdays POC for plus 20 pips

Attached Image (click to enlarge)
Click to Enlarge

Name: EURCADM30.png
Size: 49 KB


Sell limit activated on EJ with TP at yesterdays VAL

Attached Image (click to enlarge)
Click to Enlarge

Name: EURJPYM30.png
Size: 49 KB
On Point All Time Return: -53.3%
 
 
  • Post #6
  • Quote
  • Dec 16, 2020 4:23am Dec 16, 2020 4:23am
  •  alex-fx2020
  • | Joined Nov 2020 | Status: Junior Member | 9 Posts
you can use the P and b shape method for trading by market profile.
Attached Image
Attached Image
 
3
  • Post #7
  • Quote
  • Dec 16, 2020 4:27am Dec 16, 2020 4:27am
  •  sakultrader
  • | Joined Apr 2019 | Status: Member | 106 Posts
Hello Wags,

interesting thread for me. Please, would you be so kind, and can you describe your strategy a little bit deeper?

Many thanks
 
1
  • Post #8
  • Quote
  • Dec 16, 2020 5:06am Dec 16, 2020 5:06am
  •  Wags
  • Joined Aug 2017 | Status: Member | 1,609 Posts
SL moved to BE on EJ

Attached Image (click to enlarge)
Click to Enlarge

Name: EURJPYM30-be.png
Size: 50 KB
On Point All Time Return: -53.3%
 
 
  • Post #9
  • Quote
  • Dec 16, 2020 5:22am Dec 16, 2020 5:22am
  •  Wags
  • Joined Aug 2017 | Status: Member | 1,609 Posts
Quoting sakultrader
Disliked
Hello Wags, interesting thread for me. Please, would you be so kind, and can you describe your strategy a little bit deeper? Many thanks
Ignored

Hi Sakul yes of course

This is main entry , there are others but i think we can easily get enough action with this setup

1, first i look for POC on time range and see if other daily POC's are around this area creating a strong S/R , i prefer if most recent daily POC's are around this area especially previous day

2, i then look at yesterdays value area to see if it is strong or weak

3, then i look to see where yesterday closed, preferably outside yesterdays value area or if it closes inside it needs to be around the VAH or VAL, i also prefer to see price move out of yesterdays value area before it closes inside

4,i now look at first 2 30m candles of market open, do they create a small range or a wide range, smaller indicates a possible trend day and wide a possible more range like day

5, SL i keep quite tight and try to put slightly adjusted on VAH and VAL of yesterday if it allows me

6, retrace to our strong S/R to enter, i look for yesterdays POC and main POC of profile on time range, if yesterdays POC is not there i look for most recent daily POC, TP is something to see on chart as POC's or VAH, VAL depending on reward and market

Attached Image (click to enlarge)
Click to Enlarge

Name: USDJPYM30.png
Size: 44 KB
On Point All Time Return: -53.3%
 
8
  • Post #10
  • Quote
  • Dec 16, 2020 5:47am Dec 16, 2020 5:47am
  •  Wags
  • Joined Aug 2017 | Status: Member | 1,609 Posts
starting to wish i had trailed EC now

Attached Image (click to enlarge)
Click to Enlarge

Name: EURCADM30-trail.png
Size: 45 KB
On Point All Time Return: -53.3%
 
 
  • Post #11
  • Quote
  • Dec 16, 2020 6:10am Dec 16, 2020 6:10am
  •  Wags
  • Joined Aug 2017 | Status: Member | 1,609 Posts
TP hit on EJ at yesterdays VAL for 15 plus pips

Attached Image (click to enlarge)
Click to Enlarge

Name: EURJPYM30-TPH.png
Size: 50 KB
On Point All Time Return: -53.3%
 
2
  • Post #12
  • Quote
  • Dec 16, 2020 6:13am Dec 16, 2020 6:13am
  •  Wags
  • Joined Aug 2017 | Status: Member | 1,609 Posts
i adjust my TP and SL to take into account spread, so if TP was yesterdays VAL i would put TP the spread above this area on a short etc

below we can see price respecting VAL after i took profit

Attached Image (click to enlarge)
Click to Enlarge

Name: EURJPYM30-val.png
Size: 48 KB
On Point All Time Return: -53.3%
 
 
  • Post #13
  • Quote
  • Dec 16, 2020 6:14am Dec 16, 2020 6:14am
  •  PixelSniper
  • Joined Dec 2020 | Status: Member | 551 Posts
Pretty confused and gonna read all this again..
But I guess you pay attention to the previous high/los, which I also try to do
Tribute To My Chinese Buddy All Time Return: 19.0%
 
1
  • Post #14
  • Quote
  • Edited at 6:49am Dec 16, 2020 6:21am | Edited at 6:49am
  •  Wags
  • Joined Aug 2017 | Status: Member | 1,609 Posts
Looking at UC for a short now , will wait to see what price does around this area if it reaches it

I especially like this one as yesterday and day before POC plus profile on time all line up, Strong resistance there i hope

Attached Image (click to enlarge)
Click to Enlarge

Name: USDCADM30-short.png
Size: 44 KB
On Point All Time Return: -53.3%
 
 
  • Post #15
  • Quote
  • Dec 16, 2020 6:26am Dec 16, 2020 6:26am
  •  Wags
  • Joined Aug 2017 | Status: Member | 1,609 Posts
Quoting PixelSniper
Disliked
Pretty confused and gonna read all this again.. But I guess you pay attention to the previous high/los, which I also try to do
Ignored
Ive made something simple sound confusing lol, thats me though

Yes i look for as much S/R from these areas of PA as well including VAL and VAH
On Point All Time Return: -53.3%
 
1
  • Post #16
  • Quote
  • Dec 16, 2020 6:39am Dec 16, 2020 6:39am
  •  PixelSniper
  • Joined Dec 2020 | Status: Member | 551 Posts
Quoting Wags
Disliked
Would be looking to buy around the blue rectangle and risk at red rectangle {image}
Ignored
You would want to buy there because that was when the bulls accelerated?
So that's some sort of a support because that is when the bulls took price up?
Attached Image (click to enlarge)
Click to Enlarge

Name: asd123.png
Size: 45 KB
Tribute To My Chinese Buddy All Time Return: 19.0%
 
 
  • Post #17
  • Quote
  • Dec 16, 2020 6:41am Dec 16, 2020 6:41am
  •  Wags
  • Joined Aug 2017 | Status: Member | 1,609 Posts
Quoting PixelSniper
Disliked
{quote} You would want to buy there because that was when the bulls accelerated? So that's some sort of a support because that is when the bulls took price up?
Ignored

I give more preference to recent POC's on daily profiles around these areas and that was yesterdays POC i think
On Point All Time Return: -53.3%
 
1
  • Post #18
  • Quote
  • Dec 16, 2020 6:45am Dec 16, 2020 6:45am
  •  Macd-rsi
  • Joined Oct 2019 | Status: Forexian Fighter = FF | 9,167 Posts
Millionaire Expert (save as EA) | Page 68 | Forex Factory
Be yourself
 
 
  • Post #19
  • Quote
  • Dec 16, 2020 6:47am Dec 16, 2020 6:47am
  •  Wags
  • Joined Aug 2017 | Status: Member | 1,609 Posts
Quoting Macd-rsi
Disliked
Millionaire Expert (save as EA) | Page 68 | Forex Factory
Ignored
Lol yes i have seen it very nice work, i commented this on your post

Looks like a state of the art planes dashboard wouldnt want to trade with it though
On Point All Time Return: -53.3%
 
1
  • Post #20
  • Quote
  • Dec 16, 2020 7:16am Dec 16, 2020 7:16am
  •  ulle73
  • | Joined Nov 2020 | Status: Member | 158 Posts
Can you please clear what all the marked areas are?

1,
2,
3,
4,
5,
6,
Attached Image (click to enlarge)
Click to Enlarge

Name: c2d954061d03a1bd5944015b16900aa9.png
Size: 119 KB
 
 
  • Trading Systems
  • /
  • On Point
  • Reply to Thread
    • Page 1 23456 216
    • Page 1 2 216
0 traders viewing now
  • More
Top of Page
Forex Factory Blog Updated: Alerting All Members
  • Facebook
  • Twitter
About FF
  • Mission
  • Products
  • User Guide
  • Media Kit
  • Blog
  • Contact
FF Products
  • Forums
  • Trades
  • Calendar
  • News
  • Market
  • Brokers
  • Trade Explorer
FF Website
  • Homepage
  • Search
  • Members
  • Report a Bug
Follow FF
  • Facebook
  • Twitter

FF Sister Sites:

  • Metals Mine
  • Energy EXCH
  • Crypto Craft

Forex Factory® is a brand of Fair Economy, Inc.

Terms of Service / ©2022