• Home
  • Forums
  • Trades
  • News
  • Calendar
  • Market
  • Brokers
  • Login
  • Join
  • User/Email: Password:
  • 10:55pm
Menu
  • Forums
  • Trades
  • News
  • Calendar
  • Market
  • Brokers
  • Login
  • Join
  • 10:55pm
Sister Sites
  • Metals Mine
  • Energy EXCH
  • Crypto Craft

Options

Bookmark Thread

First Page First Unread Last Page Last Post

Printable Version

  • Interactive Trading
  • /
  • Reply to Thread
  • Subscribe
  • 10,906
Attachments: vsa with Malcolm
Exit Attachments

vsa with Malcolm

  • Last Post
  •  
  • 1 168016811682Page 16831684 1685
  • 1 Page 1683 1685
  •  
  • Post #33,641
  • Quote
  • Jan 7, 2021 3:25pm Jan 7, 2021 3:25pm
  •  SyntaxError
  • | Joined Oct 2020 | Status: Member | 17 Posts
if you are trading stocks EOD then the best volume data feed is ETO options data to superimpose and replace equity volume ... volume analysis really performs well with this as the options market (professional trading) always precedes the equities market

if you want forex EOD then a better data feed is to take futures continuous back adjusted and with a bit of thinking and manipulation you can create for example an accurate EURUSD data feed from two futures feeds

Forex intra day it is best to use one of the major brokers feeds say Oanda or FXCM ... sign up with a small live account and you will get real data ... its perfect of trading volume analysis
1
  • Post #33,642
  • Quote
  • Jan 8, 2021 3:34am Jan 8, 2021 3:34am
  •  freemind
  • | Joined May 2017 | Status: Member | 125 Posts
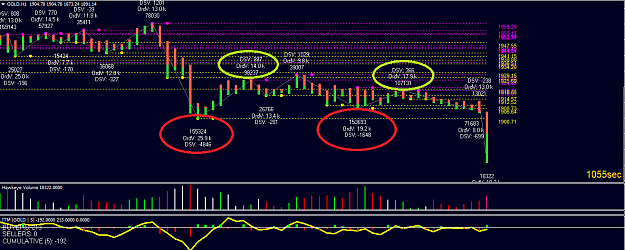
practicing keeping trades overnight (have done that many times in the past, but with mixed results), now want to do that more often, like our guy Anotan does that.
In choppy conditions WW can give you a better picture than regular vol. and after tight consolidation we usually see bigger moves happen, so its worth entering when tight range if there are good signs. all the important waves are marked on the chart. also couple of WRB zones was there which gave additional confirmation, but will leave that to WRB thread. would have added to a position during Asia session or after the last EvR wave, but i was sleeping.
Attached Image (click to enlarge)
Click to Enlarge

Name: GOLD m10 WW.png
Size: 113 KB
The more you learn the more you earn
6
  • Post #33,643
  • Quote
  • Jan 8, 2021 3:44am Jan 8, 2021 3:44am
  •  helioss
  • Joined Oct 2020 | Status: Member | 382 Posts
Yeah, it's similar to my analysis: during sideway UP LEGs have low volume than down ones.....breakout SHORT.....
Attached Image (click to enlarge)
Click to Enlarge

Name: gold.png
Size: 36 KB
2
  • Post #33,644
  • Quote
  • Jan 8, 2021 9:55am Jan 8, 2021 9:55am
  •  Anotan
  • Joined Jan 2015 | Status: Member | 621 Posts
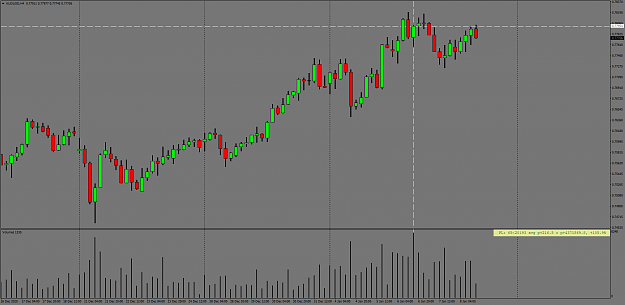
I've closed out 30% of my position on AU, I hid my trade levels because you can't really see PA with how many trades I've taken.

Going up to a H4 chart on Jan 6th and 7th you can see a 2 bar reversal with a ND UT at the top.. along with some very high volume. Price has had an extensive up move and with the high volume coming in, the pair is vulnerable to a down move.

I'm still bullish on the pair and will hold on to the rest seeing if we can reach .79-.8, mainly bc of monthly chart and how price reacted to the US election volume in Nov 4th. There are more than a few posts in my history where I've shown charts and talked about it enough .

This is by far the best trade of my career, I think the first trade was taken around 7250.
Attached Image (click to enlarge)
Click to Enlarge

Name: AUDUSDH4.png
Size: 57 KB
7
  • Post #33,645
  • Quote
  • Jan 8, 2021 10:05am Jan 8, 2021 10:05am
  •  Anotan
  • Joined Jan 2015 | Status: Member | 621 Posts
Quoting HiddenGap
Disliked
I just realized that there are currently 3 or 4 "active" threads discussing the virtues (or lack thereof) of using volume in forex. I submit that this wave of interest is in no small part due to the knowledge and fun-packed posts from Anotan. Thank you Anotan.
Ignored
I appreciate the kind words. I didn't realize that there were that many, I saw the OnPoint thread and read that a little bit.
  • Post #33,646
  • Quote
  • Jan 8, 2021 12:38pm Jan 8, 2021 12:38pm
  •  helioss
  • Joined Oct 2020 | Status: Member | 382 Posts
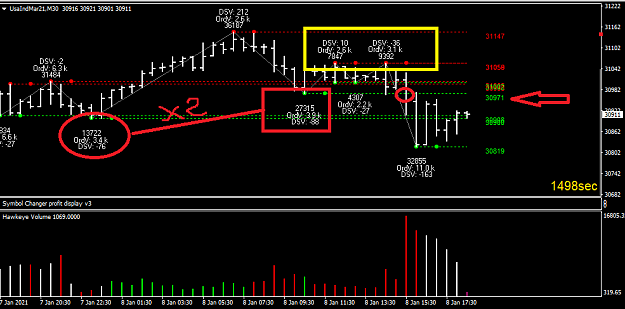
UsaIndMar21: nice short

Red: DOWN Leg with HIGH VOLUME (double previous one)
Yellow: very low volume
Breakout
Attached Image (click to enlarge)
Click to Enlarge

Name: usa.png
Size: 24 KB
1
  • Post #33,647
  • Quote
  • Jan 8, 2021 3:11pm Jan 8, 2021 3:11pm
  •  HiddenGap
  • Joined Aug 2009 | Status: Reading the tape | 2,231 Posts
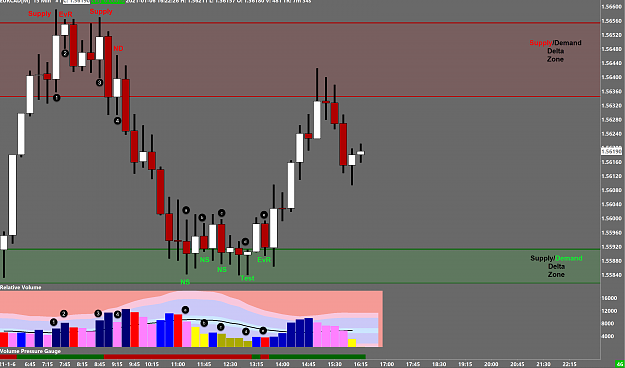
Chart dumps

Attached Image (click to enlarge)
Click to Enlarge

Name: SD ProVolume 14.png
Size: 187 KB


Attached Image (click to enlarge)
Click to Enlarge

Name: SD ProVolume 15.png
Size: 175 KB
The TREND isn't just your friend; it's your lover.
5
  • Post #33,648
  • Quote
  • Jan 8, 2021 10:31pm Jan 8, 2021 10:31pm
  •  pooh123
  • Joined Jul 2012 | Status: Member | 774 Posts
Quoting freemind
Disliked
practicing keeping trades overnight (have done that many times in the past, but with mixed results), now want to do that more often, like our guy Anotan does that. In choppy conditions WW can give you a better picture than regular vol. and after tight consolidation we usually see bigger moves happen, so its worth entering when tight range if there are good signs. all the important waves are marked on the chart. also couple of WRB zones was there which gave additional confirmation, but will leave that to WRB thread. would have added to a position...
Ignored
Great post. That EvR you marked on the up wave, with number 1011 in the box, was it based on volume and length comparison with the previous up wave or previous down wave ?
  • Post #33,649
  • Quote
  • Jan 9, 2021 3:37am Jan 9, 2021 3:37am
  •  Viki84
  • Joined Mar 2019 | Status: Member | 159 Posts
Quoting HiddenGap
Disliked
Chart dumps {image} {image}
Ignored
Hi HiddenGap! Can i ask how u draw your supply demand delta zone? Or this is a indicator? Thank you!
Time is your friend; impulse is your enemy! - John Bogle
  • Post #33,650
  • Quote
  • Jan 9, 2021 9:53am Jan 9, 2021 9:53am
  •  Shantala
  • Joined Aug 2012 | Status: Reading the market | 194 Posts
Quoting Viki84
Disliked
{quote} Hi HiddenGap! Can i ask how u draw your supply demand delta zone? Or this is a indicator? Thank you!
Ignored
Refer post #27294, HiddenGap Posts pdf

or find it on thread attachment page 3.
1
  • Post #33,651
  • Quote
  • Jan 9, 2021 11:57am Jan 9, 2021 11:57am
  •  Viki84
  • Joined Mar 2019 | Status: Member | 159 Posts
Quoting Shantala
Disliked
{quote} Refer post #27294, HiddenGap Posts pdf or find it on thread attachment page 3.
Ignored
Thank you!
Time is your friend; impulse is your enemy! - John Bogle
  • Post #33,652
  • Quote
  • Jan 10, 2021 5:41am Jan 10, 2021 5:41am
  •  freemind
  • | Joined May 2017 | Status: Member | 125 Posts
Quoting pooh123
Disliked
{quote} Great post. That EvR you marked on the up wave, with number 1011 in the box, was it based on volume and length comparison with the previous up wave or previous down wave ?
Ignored
Hi Pooh, there are many ways to set up WW (i have tried several indicators and the current one i have bought from mql5 and the other i use is on sierra charts and tick charts), i have experimented with many settings. The current setup shows total volume in the wave with price mode of the middle price (dont confuse it with average vol (ord vol) thats different) (price mode with close prices are ok, but its more choppy and with this one it's easier to spot reversals) and the period of 2.
THOUGH, i suggest you to use it with another strategy if you want to be really good at it (or you need to have exceptionally good skills in WW reading), of course, for this the best fit is Wyckoff. why? because it talks about volume and waves and their length and importance of the place (to me VSA is a simplified version of Wyckoff and missing several important things).
it takes time to get good with WW, it often looks amazing in hindsight, but when you are trading it live there may be several confusions. for example, you see EvR in range, like for gold, it does not mean its immediate sell, you need to see the background and have a correct interpretation of other waves, because there may be a small vol down wave and then we shoot up, the EvR wave also can be demand wave, so you need to look at other waves and PA. In this case, we saw a massive down move and the following up move was higher vol then all the down move, though, it was waaay smaller and then on all the up moves we saw high vol with followed down move.
During the learning process (though, its never-ending) i have over 300 pictures/screenshots from charts with WW and their analysis. Its amazing tool, but as with all - it takes time and patience.
The more you learn the more you earn
4
  • Post #33,653
  • Quote
  • Jan 10, 2021 8:29am Jan 10, 2021 8:29am
  •  Shantala
  • Joined Aug 2012 | Status: Reading the market | 194 Posts
@HiddenGap, when will you close these zones?

Attached Image (click to enlarge)
Click to Enlarge

Name: ZoneClose.png
Size: 75 KB
1
  • Post #33,654
  • Quote
  • Edited at 9:22am Jan 10, 2021 9:10am | Edited at 9:22am
  •  RickM
  • Joined Sep 2015 | Status: Member | 1,126 Posts
Quoting HiddenGap
Disliked
"Weakness, when it appears, usually appears on UP bars." "Strength, when it appears, usually appears on DOWN bars." The above statements are considered "first principles" in Volume Spread Analysis (VSA). Much of the reason Gavin (incorrectly) considers himself a contrarian trader comes from these "first principles". He's not. He is a trend trader. There's nothing wrong with being a trend trader, but by definition, you can't be both. Or can you? Of course you can, but let's back up and look at the "first principles" and leave the trend discussion...
Ignored
Hi HiddenGap

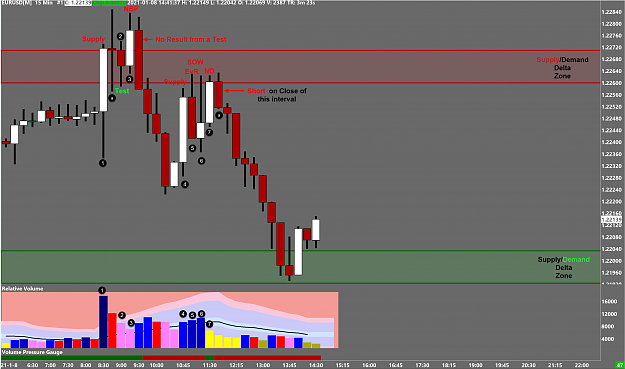
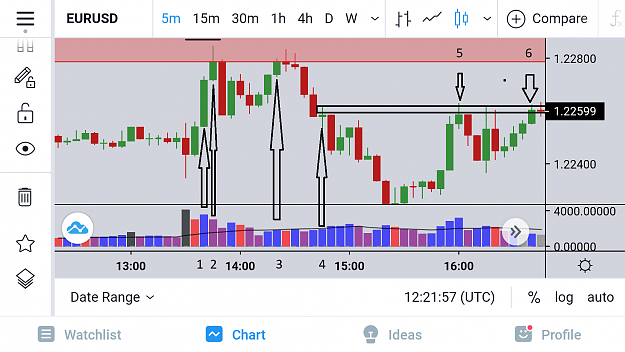
Nice description of VSA and please let me explain a trade setup I took late last week.
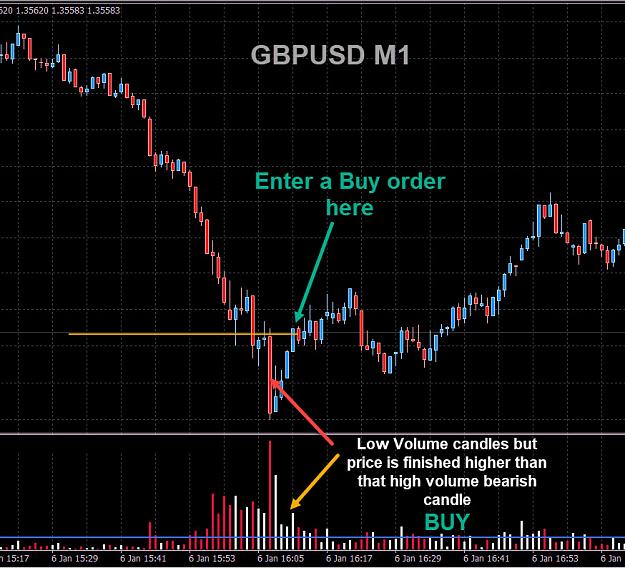
I always trade M1 looking for exhaustion but like to wait for Volume to tell me when to enter.

We see this large red bearish volume candle which may indicate Sellers were entering the market in high numbers - Delta was telling me they were mostly sellers.
It would be a high chance a buy now at that close of that large volume candle might be a good time to enter, however we have no volume signal yet.
I was looking to enter if I believed those sellers would become trapped which they did a few candles later. Those white bullish candles 2, 3, 4 all had quite low volume compared to the large bearish candle - however it forced price above the open of that large bearish candle.
What has happen is there were no sellers, just buyers. If those white candles 2,3,4 were large, that would mean a struggle was still occurring.

BUT NO STRUGGLE - Just Buyers so I took a trade on the fourth White Candle.

And just did nothing - for some nice pips.

Cheers
Attached Image (click to enlarge)
Click to Enlarge

Name: GU BUY DISCORD.jpg
Size: 173 KB
Trading thin liquidity at the boundary of the charts
5
  • Post #33,655
  • Quote
  • Jan 10, 2021 10:02am Jan 10, 2021 10:02am
  •  bandler
  • | Joined Apr 2020 | Status: Junior Member | 5 Posts
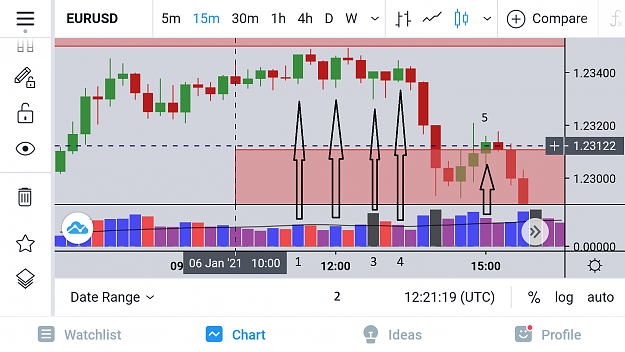
Hi not sure if this is the correct place please can i ask for an assessment of whether i am on the right track?? this was from the Eur/Usd 6th Jan

Sell

6 o'clock bar closed at 10 o'clock high volume wide spread up-bar coming up to a strong resistance area
Attached Image (click to enlarge)
Click to Enlarge

Name: 4hr.png
Size: 129 KB

15 Min Chart
Attached Image (click to enlarge)
Click to Enlarge

Name: 15min.png
Size: 143 KB
After the 10 o'clock 4hr close

1. Is a wide spread up-bar average volume

2. Creates a lower low than bar 1, also notice the volume is not as high in relation to bar 1 (possible entry with SL a couple pips higher than bar 1)

3. All that effort/volume to go up, something is capping/stopping the price from going up, aka squat bar (another entry bar)

4. Volume lower than the previous 2 No Demand (entry)

5. Another No demand entry bar for good measure

5 Min Chart
Attached Image (click to enlarge)
Click to Enlarge

Name: 5min.png
Size: 144 KB

After 10 o'clock close 4hr close

1. Is a wide spread up-bar
2. Next bar hits the zone, note volume dropped off, no demand bar? though need confirmation this comes 7 bars later in bar 3.

3 . Bar comes up to previous high again look at the volume its dropped off in relation to Bar 2, little if any effort to go up first entry on the close SL goes above bar 2 Pin.

4. Squat bar entry, though bigger SL again above bar 2 pin

5. Squat bar entry.

6. No demand entry.

Thanks in advance
3
  • Post #33,656
  • Quote
  • Jan 10, 2021 10:03am Jan 10, 2021 10:03am
  •  ppuruswani
  • | Joined Sep 2015 | Status: Member | 219 Posts
Attached Image (click to enlarge)
Click to Enlarge

Name: download (3).png
Size: 67 KB
4
  • Post #33,657
  • Quote
  • Jan 10, 2021 1:11pm Jan 10, 2021 1:11pm
  •  HiddenGap
  • Joined Aug 2009 | Status: Reading the tape | 2,231 Posts
Quoting RickM
Disliked
{quote} Hi HiddenGap Nice description of VSA and please let me explain a trade setup I took late last week. I always trade M1 looking for exhaustion but like to wait for Volume to tell me when to enter. We see this large red bearish volume candle which may indicate Sellers were entering the market in high numbers - Delta was telling me they were mostly sellers. It would be a high chance a buy now at that close of that large volume candle might be a good time to enter, however we have no volume signal yet. I was looking to enter if I believed those...
Ignored
Thank you for the post. I am a fan. I'm really glad you posted here and I hope you will post more. There's a lot we all could learn from you.
The TREND isn't just your friend; it's your lover.
1
  • Post #33,658
  • Quote
  • Jan 10, 2021 1:23pm Jan 10, 2021 1:23pm
  •  HiddenGap
  • Joined Aug 2009 | Status: Reading the tape | 2,231 Posts
Quoting Shantala
Disliked
@HiddenGap, when will you close these zones? {image}
Ignored
I literally just spent an hour on a detailed answer to this post. But then I accidentally clicked on the calendar and lost it all. I may come back and readdress this post, but for now, this is it.

Attached Image (click to enlarge)
Click to Enlarge

Name: Exsmple 1.png
Size: 425 KB


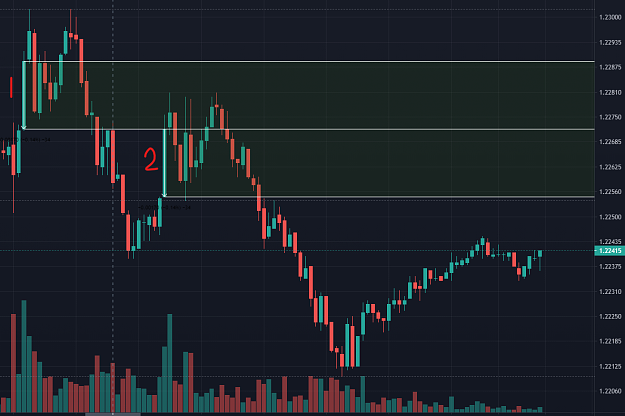
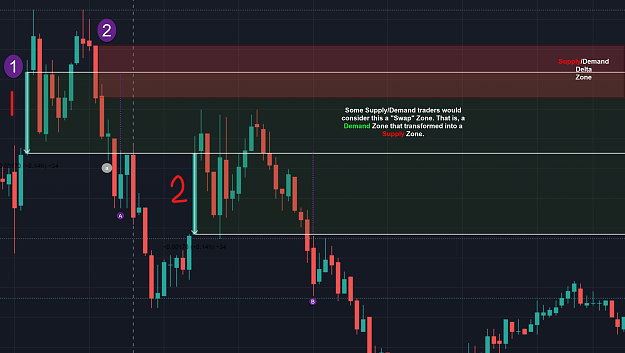
I look for a full body (open-close) above or below a Supply Zone or Demand Zone, respectively, in order to consider the Zone closed. Therefore, points A and B would close the Zones for me.

Note: My original post delves into why these would not be considered Zones by me, although they are considered such by other traders. I also got into the concept of "Swap Zones" and "Zone Reactivation"-neither of which I employ. But my way isn't the only way.
The TREND isn't just your friend; it's your lover.
3
  • Post #33,659
  • Quote
  • Jan 10, 2021 1:47pm Jan 10, 2021 1:47pm
  •  Shantala
  • Joined Aug 2012 | Status: Reading the market | 194 Posts
Quoting HiddenGap
Disliked
{quote} I literally just spent an hour on a detailed answer to this post. But then I accidentally clicked on the calendar and lost it all. I may come back and readdress this post, but for now, this is it. {image} I look for a full body (open-close) above or below a Supply Zone or Demand Zone, respectively, in order to consider the Zone closed. Therefore, points A and B would close the Zones for me. Note: My original post delves into why these would not be considered Zones by me, although they are considered such by other traders. I also got into...
Ignored
Thanks for your kind answer.

I am also not using "swap zones." I too noticed the 2nd zone you have drawn, but I intentionally omitted that as PA not happened in that zone, so not concerned to my question of interest.
  • Post #33,660
  • Quote
  • Jan 15, 2021 12:12pm Jan 15, 2021 12:12pm
  •  dr_who
  • | Joined Oct 2007 | Status: Member | 431 Posts
Now I haven't read the whole thread, however I know a fair amount about VSA as I used (then abandoned) the concept a few years ago.

The big question for me is how the hell do you trade forex using VSA as, particularly for traders using MT4, your Volume is nonsense and doesn't necessarily reflect the entire market, in fact that in itself is probably impossible ?

I am happy to be educated...
  • Interactive Trading
  • /
  • vsa with Malcolm
  • Reply to Thread
    • 1 168016811682Page 16831684 1685
    • 1 Page 1683 1685
2 traders viewing now
  • More
Top of Page
  • Facebook
  • Twitter
About FF
  • Mission
  • Products
  • User Guide
  • Media Kit
  • Blog
  • Contact
FF Products
  • Forums
  • Trades
  • Calendar
  • News
  • Market
  • Brokers
  • Trade Explorer
FF Website
  • Homepage
  • Search
  • Members
  • Report a Bug
Follow FF
  • Facebook
  • Twitter

FF Sister Sites:

  • Metals Mine
  • Energy EXCH
  • Crypto Craft

Forex Factory® is a brand of Fair Economy, Inc.

Terms of Service / ©2021