• Home
  • Forums
  • Trades
  • News
  • Calendar
  • Market
  • Brokers
  • Login
  • Join
  • User/Email: Password:
  • 1:43am
Menu
  • Forums
  • Trades
  • News
  • Calendar
  • Market
  • Brokers
  • Login
  • Join
  • 1:43am
Sister Sites
  • Metals Mine
  • Energy EXCH
  • Crypto Craft

Options

Bookmark Thread

First Page First Unread Last Page Last Post

Print Thread

Similar Threads

VSA-divergence trading 187 replies

How to Blow $200 account using VSA--- 594 replies

VSA Journal 57 replies

VSA broker history change datas 11 replies

  • Interactive Trading
  • /
  • Reply to Thread
  • Subscribe
  • 12,008
Attachments: vsa with Malcolm
Exit Attachments

vsa with Malcolm

  • Last Post
  •  
  • 1 16801681Page 168216831684 1784
  • 1 Page 1682 1784
  •  
  • Post #33,621
  • Quote
  • Dec 20, 2020 11:48pm Dec 20, 2020 11:48pm
  •  SyntaxError
  • | Joined Oct 2020 | Status: Member | 91 Posts
That not what Tom or Sebastian said

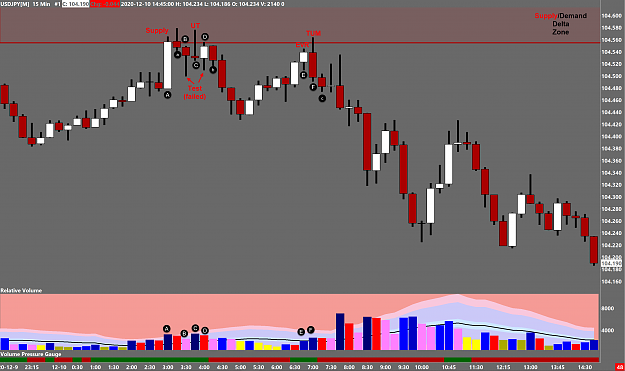
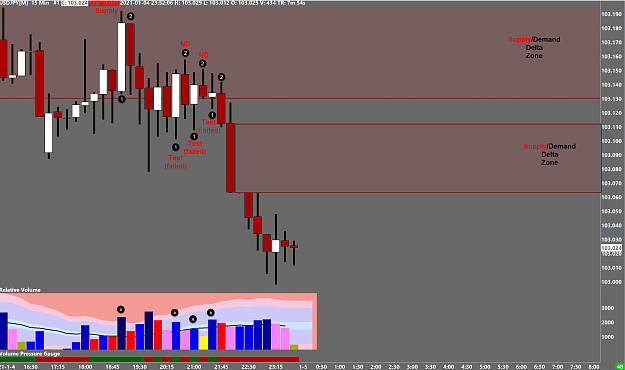
A test is a test is a test

The reaction to it is the important point

Simply it passes the test or fails and then steadily moves up on diminished volume preferably
 
 
  • Post #33,622
  • Quote
  • Dec 21, 2020 2:11am Dec 21, 2020 2:11am
  •  Anotan
  • Joined Jan 2015 | Status: Member | 1,050 Posts | Invisible
Quoting pooh123
Disliked
I dimly recall that, it is either mentioned by Sebastian Manby or description of Tradeguider indicators that, a low-volume test is only meaningful when it makes a lower low than its prior bar. Can someone confirm that ?
Ignored
In his webinars Tom repeated over and over they don't use mathematical formulas, which maybe I'm reading too much into that statement , but putting those kinds of rules seems like it would be considered a mathematical formula. Either way IMO I think putting hard rules such as that would only hold you back.

Probably more important to find the intent rather than trying to find the perfect pattern. I personally wasted a few years trying to find the perfect pattern of bars based on VSA, I eventually learned that they work for a little while but market conditions change and the pattern becomes worthless.

Heres a random chart dump.

EURUSD highest volume bar during the Euro session for Dec 17th found a little support on Friday which price didn't do much with it, today as the markets opened up price rejected the the trigger and came off.

Right now I have no idea why price is respecting the bottom trigger number at 2183, I wouldn't trade it. I was just going through charts and noticed it.

**Edit** I'm confused why its respecting that particular trigger number, I would've though it would be the trigger number from either the FOMC shakeout or the wide spread up bar during London session.
Attached Image (click to enlarge)
Click to Enlarge

Name: EURUSDH1.png
Size: 58 KB
Trading isn't about being right, it's about exploiting your edge.
 
3
  • Post #33,623
  • Quote
  • Dec 21, 2020 4:47pm Dec 21, 2020 4:47pm
  •  SyntaxError
  • | Joined Oct 2020 | Status: Member | 91 Posts
Here are the facts

There is a very simple moving average calculation used to find the Volume bands and then the six individual gradations on volume from Very Low up to Ultra High

The individual bars have a maximum look back period of 3 to determine things like a spring or a shakeout. They use their own non mathematical formula (think permutations) to work the 100 or so variants that you see in conjunction with the volume reading on each bar. A clear thinker can work them out.

There are actually better performing patterns than others such as a high intensity shakeout but the subtle thing to think about is the multiple occurrence of patterns on each bar ; this is the secret to and the power behind Volume Analysis

The whole precept of Volume Analysis is good once you get into the thinking behind it and remember that Tom was a simple person wanting to share simple but powerful ideas it is true simplicity and genius

Anotatan

Forget the trigger numbers .. that kangaroo tail at 1500 pm 16th Dec had ultra High Volume and Ultra Wide Range and Down bar in the right place on the chart. It also had multiple instances of stopping volume on the bar. The market was turning ... Place your long stop to get in on stop a few ticks above the high of that bar .. conservative stop below the low of the bar and wait for the market to react to the bar .. that how you trade this setup

Enjoy
 
 
  • Post #33,624
  • Quote
  • Dec 22, 2020 12:19pm Dec 22, 2020 12:19pm
  •  HiddenGap
  • Joined Aug 2009 | Status: Reading the tape | 2,297 Posts
Quoting pooh123
Disliked
I dimly recall that, it is either mentioned by Sebastian Manby or description of Tradeguider indicators that, a low-volume test is only meaningful when it makes a lower low than its prior bar. Can someone confirm that ?
Ignored
This is somewhat correct. A more appropriate way to say this is, Tests that make a lower low than the previous bar tend to be more meaningful than those Tests that do not.

Think about it logically.

A Test is designed to ferret out sellers (supply). Selling a new low is a common practice, even among institutions. Accordingly, if you wanted to see if sellers were still present, you would want to push price lower than the previous bar (thus making a de facto new low).

In addition, the fact that the previous low failed also tends to bring out many sellers. The previous low represents the lowest point the market could go before buyers stepped in and held price. If the next interval goes lower, then the sellers would assume the buyers are no longer willing or able to hold price up. Which gives the sellers an incentive to sell. In other words, by making a lower low, a Test attempts to induce sellers to enter the market.

Personally, if the interval does not make a lower low, I call it No Supply.

With respect to "mathematical formulas" VSA is filled with them. They're just called logical expressions.

Volume less than the previous two intervals is a logical expression but clearly, there is mathematics involved in defining less than.

One definition of an Up Thrust in TradeGuider is a wide spread UP bar on increasing volume that closes in the lower 25% of its range. Again mathematics is employed in the definition. On an aside note, although most indications need confirmation, all indicators are always true. That is, by definition when you see an indication of strength or weakness the rule set exists.
The Market is either drawing to liquidity or running to an imbalance.
 
4
  • Post #33,625
  • Quote
  • Dec 22, 2020 12:45pm Dec 22, 2020 12:45pm
  •  HiddenGap
  • Joined Aug 2009 | Status: Reading the tape | 2,297 Posts
(continuing from my previous post) Here's a good example to t.hink about.

Attached Image (click to enlarge)
Click to Enlarge

Name: SD ProVol ex.png
Size: 99 KB


A. This is a narrow range UP bar on increasing (Climatic) volume.

B. The fact that this bar DOWN confirms the selling (Supply) on the previous interval.

At this point, there is SUPPLY in the market. The sellers have shown themselves.

C. A narrow range UP bar on volume less than the previous two intervals. That's the base definition of No Demand. But is this really No Demand? No. What makes this a Test is the fact that there is a lower low. The Smart Money wants to see if selling begets more selling. So they first take price lower, when they don't see any takers, they push price up the high. Then bam we get the next interval.

And yes, Tom, Sebastain, Gavin, Todd Kreuger, et all have said this at least once.
The Market is either drawing to liquidity or running to an imbalance.
 
5
  • Post #33,626
  • Quote
  • Dec 22, 2020 3:42pm Dec 22, 2020 3:42pm
  •  helioss
  • Joined Oct 2020 | Status: Member | 1,503 Posts
Very nice discussion

This is my view on GBPUSD 30min: DOWN SWINGs have BIGGER VOLUME than UP SWINGs, so trend seems to be SHORT
Attached Image (click to enlarge)
Click to Enlarge

Name: gu.png
Size: 26 KB
 
 
  • Post #33,627
  • Quote
  • Dec 22, 2020 5:05pm Dec 22, 2020 5:05pm
  •  SyntaxError
  • | Joined Oct 2020 | Status: Member | 91 Posts
Adding some context to HGs image

0900 20201222 was a strong bottom reversal bar .. Up Bar Close Hi Avg Range Avg Volume

This setup the move north after an earlier test @0815 am
 
 
  • Post #33,628
  • Quote
  • Dec 23, 2020 2:32am Dec 23, 2020 2:32am
  •  Vcv13
  • Joined Feb 2013 | Status: Member | 262 Posts
Quoting pooh123
Disliked
I dimly recall that, it is either mentioned by Sebastian Manby or description of Tradeguider indicators that, a low-volume test is only meaningful when it makes a lower low than its prior bar. Can someone confirm that ?
Ignored

without understanding price structure, chart analysis is not complete.

what is more meaningful is 'what is being tested' & not a 'lower low than its prior bar'

when we ask what is being tested, we would like to see whether a previous high/low, or an important support/resistance level or the low of a demand/buying bar or the high of a supply/selling bar is being tested.

Attached Image (click to enlarge)
Click to Enlarge

Name: SD ProVol ex.png
Size: 100 KB
The loss was not bad luck. It was bad Analysis - D.Einhorn
 
1
  • Post #33,629
  • Quote
  • Dec 23, 2020 4:10am Dec 23, 2020 4:10am
  •  pooh123
  • Joined Jul 2012 | Status: Member | 787 Posts
Quoting Vcv13
Disliked
{quote} without understanding price structure, chart analysis is not complete. {image}
Ignored
I was just asking about definition of a test bar while fully aware that, even if you have a text book test bar, it does not guarantee the trade will work out, and often times, even if your test bar is unorthodoxy, the trade still works out. The background is always far more important than a single test or no-demand bar.
 
2
  • Post #33,630
  • Quote
  • Dec 24, 2020 10:54am Dec 24, 2020 10:54am
  •  Anotan
  • Joined Jan 2015 | Status: Member | 1,050 Posts | Invisible
Quoting Vcv13
Disliked
{quote} without understanding price structure, chart analysis is not complete. what is more meaningful is 'what is being tested' & not a 'lower low than its prior bar' when we ask what is being tested, we would like to see whether a previous high/low, or an important support/resistance level or the low of a demand/buying bar or the high of a supply/selling bar is being tested. {image}
Ignored
Good stuff, hope to see more posts from you.
Trading isn't about being right, it's about exploiting your edge.
 
 
  • Post #33,631
  • Quote
  • Dec 24, 2020 12:56pm Dec 24, 2020 12:56pm
  •  Anotan
  • Joined Jan 2015 | Status: Member | 1,050 Posts | Invisible
EURCAD nice UT on daily.

Trigger number off the 21st, yesterday during the first half of the day price was just flopping around that trigger with no clear signs that anyone was actively trading the pair, but logging in today I saw price reject the trigger during yesterday's US session and then price came off breaking the previous low.

Seemed like a safe short, just looking for 1.5600 on this.
Attached Images (click to enlarge)
Click to Enlarge

Name: EURCADDaily.png
Size: 77 KB Click to Enlarge

Name: EURCADH1.png
Size: 79 KB
Trading isn't about being right, it's about exploiting your edge.
 
4
  • Post #33,632
  • Quote
  • Dec 24, 2020 1:11pm Dec 24, 2020 1:11pm
  •  Anotan
  • Joined Jan 2015 | Status: Member | 1,050 Posts | Invisible
Oh and....

https://www.youtube.com/watch?v=Oa8d6yATO6o
Trading isn't about being right, it's about exploiting your edge.
 
2
  • Post #33,633
  • Quote
  • Dec 29, 2020 8:47pm Dec 29, 2020 8:47pm
  •  Anotan
  • Joined Jan 2015 | Status: Member | 1,050 Posts | Invisible
Who ever is running EJ isn't even attempting to hide their tracks..

Bar A - Bearish down bar, not great to see a wide spread down bar after an up move.

Bar B - Wide spread up bar pushing up and wider than Bar A, cancelling out Bar A.

Bar C - 2 bar reversal

Bar D - hidden test.

Attached Image (click to enlarge)
Click to Enlarge

Name: EURJPYH1.png
Size: 56 KB


I went a little crazy yesterday with my EJ buys and got a margin call in late US session . My broker closed out of a few of my EJ longs and a chunk of my AU longs. AU is still very strong, daily chart we have a shake out on Dec 21st and then a 2 bar reversal with price steadily climbing ever since.

Attached Image (click to enlarge)
Click to Enlarge

Name: AUDUSDDaily.png
Size: 82 KB
Trading isn't about being right, it's about exploiting your edge.
 
5
  • Post #33,634
  • Quote
  • Jan 1, 2021 6:08am Jan 1, 2021 6:08am
  •  freemind
  • | Joined May 2017 | Status: Member | 163 Posts
Quoting Anotan
Disliked
Who ever is running EJ isn't even attempting to hide their tracks.. Bar A - Bearish down bar, not great to see a wide spread down bar after an up move. Bar B - Wide spread up bar pushing up and wider than Bar A, cancelling out Bar A. Bar C - 2 bar reversal Bar D - hidden test. {image} I went a little crazy yesterday with my EJ buys and got a margin call in late US session . My broker closed out of a few of my EJ longs and a chunk of my AU longs. AU is still very strong, daily chart we have a shake out on Dec 21st and then...
Ignored
i fucking love these charts when you go full margin mode and ignore what mainstream literature says about the risk. I know Malcolm does this quite often as well.
Surprised that dow gave so good move into NY close. Tick charts with weis wave (RIP) are often a very good combo.
Attached Image (click to enlarge)
Click to Enlarge

Name: dow 700 tick.png
Size: 39 KB
The more you learn the more you earn
 
6
  • Post #33,635
  • Quote
  • Jan 2, 2021 4:10pm Jan 2, 2021 4:10pm
  •  HiddenGap
  • Joined Aug 2009 | Status: Reading the tape | 2,297 Posts
I just realized that there are currently 3 or 4 "active" threads discussing the virtues (or lack thereof) of using volume in forex. I submit that this wave of interest is in no small part due to the knowledge and fun-packed posts from Anotan. Thank you Anotan. You carry the VSA torch well and all who come here are made better because of you.

I wanted to make a post to show some principles. Everything has been said before. Markets do not change; they are and always will be based on Supply and Demand. Yes, Markets fluctuate between periods of balance (range) and periods of imbalance (trend), but the underlying essence remains the same. Yes, technologies come and go. Yes, the speed of execution increases as does access to information. But what lies beneath the new shiny tools of the moment, is Supply and Demand. Volume Spread Analysis (VSA) analyzes bars (or candles) and volume-per-bar in order to determine price direction by measuring the amount of Supply and Demand present in the Market. Accordingly, VSA will always work.

Take a look at the chart below.

Disclaimer: Volume Spread Analysis (VSA) is not magic. You will make losing trades. I am not implying, nor should you infer that Volume Spread Analysis (VSA) is the holy grail. If you're going to trade (any method), you must learn to accept losses. They are the cost of doing business.


Attached Image (click to enlarge)
Click to Enlarge

Name: SD ProVolume 5.png
Size: 160 KB


A. A wide spread UP interval on Ultra High or Climatic Volume. One of the first principles of VSA is, weakness when it appears, usually appears on UP bars. This interval closes a bit off its high, but the real clue is the next interval. It closes DOWN. If the first interval was strong, then how could the next interval be DOWN? Thus, from a VSA perspective, this is Supply.

This is our starting point. 95-98% of the volume represents the activity of Smart Money. Identifying when the Smart Money is active is key. When the Big Boys get active, we should get interested.

B. This is a Test. What's being tested? The Supply that appeared two intervals prior. The Smart Money wants to see if selling begets more selling. They do this by driving prices lower (making a lower low) to see if this entices new sellers to show themselves. If new sellers do not appear, the Market is, at least at the moment, more strong than weak. Since the next interval closes DOWN, this Test fails and is, therefore, a sign of weakness.

C. Again, this interval closes DOWN and causes the test to fail. Looking at this interval further, we see an interval that made a higher high but closed near the low of its range on Ultra High or Climatic Volume. If this was a bullish interval, how could it close on its low? The low close tells us that there must have been some selling (Supply) in this interval. This is an Up Thrust type of interval.

We are doing a bar-by-bar analysis, but we can step back and take a look at the bigger picture. We have seen a Supply, a Test (failed), and now an Up Thrust. This is a reasonable place to take a short. Especially, if the Up Thrust confirms with the next bar DOWN.

As this is a post on VSA, I am ignoring the elephant on the chart: the Supply/Demand Delta Zone via Wide Range Body (WRB) Analysis. This is the "where you want to see it" portion of my "what you want to see, where you want to see it.

D. This is another Test. Again, what is being tested? The Supply that showed itself in the previous interval and the initial Supply from bar A. Since this interval closes higher than the previous interval, it does not confirm the Up Thrust. Nevertheless, the Smart Money wants to ferret out any sellers by driving prices lower. With the next interval DOWN, this Test Fails.

A good place to get short.

In case you missed it. The Market gives you another opportunity to jump on this train before it goes down.

E. A narrow range UP bar on increasing volume that is Climatic. Yes, the volume is less than the volume seen on A, but volume is relative. And this is the highest volume in the last 10 periods. The question is, "why is the volume increasing as the range decreases"? Something must be causing the range/volume ratio to be disproportionate. That "something" is Supply. The Smart Money is happily selling to willing buyers in such a manner that is compressing the range of the interval. Retail traders think they're getting a good deal. They're wrong.

The effort (as seen in the volume) does not match the result (as seen in the range). This is Effort v Result. Bill Williams would call this a squat. And while all squats do not mark the end of a trend, all trends end with a squat in one of the last 1 to 5 intervals.

F. Closing DOWN from the previous interval confirms the EvR. This wide spread interval that makes a higher high than the previous interval and makes a lower low and closes near its low on Climatic Volume is a Trap Up Move.

c. This interval confirms the TUM and should bring you into the Market if you're not already in short.
The Market is either drawing to liquidity or running to an imbalance.
 
11
  • Post #33,636
  • Quote
  • Jan 5, 2021 2:10pm Jan 5, 2021 2:10pm
  •  HiddenGap
  • Joined Aug 2009 | Status: Reading the tape | 2,297 Posts
"Weakness, when it appears, usually appears on UP bars."

"Strength, when it appears, usually appears on DOWN bars."

The above statements are considered "first principles" in Volume Spread Analysis (VSA). Much of the reason Gavin (incorrectly) considers himself a contrarian trader comes from these "first principles". He's not. He is a trend trader. There's nothing wrong with being a trend trader, but by definition, you can't be both. Or can you?

Of course you can, but let's back up and look at the "first principles" and leave the trend discussion for another time.

Check out the cart below.

Attached Image (click to enlarge)
Click to Enlarge

Name: SD ProVolume 13.png
Size: 159 KB


1. When we see an UP bar (close>close (-1) on increasing volume (a) with the next interval DOWN (2). The only way this can happen is if there was actually some selling (Supply) on the UP interval (1).

To be clear, just seeing this pattern occur isn't a sufficient condition to get short. But it is almost always necessary.
The Market is either drawing to liquidity or running to an imbalance.
 
10
  • Post #33,637
  • Quote
  • Jan 7, 2021 8:45am Jan 7, 2021 8:45am
  •  Shantala
  • Joined Aug 2012 | Status: Reading the market | 282 Posts
@HiddenGap

Great teaching!!!

@All

Which is good relative volume indicator for TradingView?
 
 
  • Post #33,638
  • Quote
  • Jan 7, 2021 11:52am Jan 7, 2021 11:52am
  •  freemind
  • | Joined May 2017 | Status: Member | 163 Posts
Quoting Shantala
Disliked
@HiddenGap Great teaching!!! @All Which is good relative volume indicator for TradingView?
Ignored
their regular volume is ok, use that. if you want to go further sign for futures data feed and get that volume.
The more you learn the more you earn
 
1
  • Post #33,639
  • Quote
  • Jan 7, 2021 1:00pm Jan 7, 2021 1:00pm
  •  Shantala
  • Joined Aug 2012 | Status: Reading the market | 282 Posts
Quoting freemind
Disliked
{quote} their regular volume is ok, use that. if you want to go further sign for futures data feed and get that volume.
Ignored
I have futures data, but there is huge volume difference between overnight and regular sessions of Dow, so thought of using relative volume.
 
 
  • Post #33,640
  • Quote
  • Jan 7, 2021 1:07pm Jan 7, 2021 1:07pm
  •  freemind
  • | Joined May 2017 | Status: Member | 163 Posts
Quoting Shantala
Disliked
{quote} I have futures data, but there is huge volume difference between overnight and regular sessions of Dow, so thought of using relative volume.
Ignored
i suggest you to use futures volume feed, especially if you are planning to trade dow. the vol is higher when NY opens and if you want to see the vol better/clearer on smaller vol periods you can zoom in the chart or you can expand volumes vertically so the small ones grow bigger. also to distinguish volumes better you can use better volume indicator or you can put just Bollinger bands over volume so you see the bars that have increased vol easily.
The more you learn the more you earn
 
1
  • Interactive Trading
  • /
  • vsa with Malcolm
  • Reply to Thread
    • 1 16801681Page 168216831684 1784
    • 1 Page 1682 1784
1 trader viewing now
  • More
Top of Page
Forex Factory Blog Updated: Alerting All Members
  • Facebook
  • Twitter
About FF
  • Mission
  • Products
  • User Guide
  • Media Kit
  • Blog
  • Contact
FF Products
  • Forums
  • Trades
  • Calendar
  • News
  • Market
  • Brokers
  • Trade Explorer
FF Website
  • Homepage
  • Search
  • Members
  • Report a Bug
Follow FF
  • Facebook
  • Twitter

FF Sister Sites:

  • Metals Mine
  • Energy EXCH
  • Crypto Craft

Forex Factory® is a brand of Fair Economy, Inc.

Terms of Service / ©2022