• Home
  • Forums
  • Trades
  • News
  • Calendar
  • Market
  • Brokers
  • Login
  • Join
  • User/Email: Password:
  • 12:27am
Menu
  • Forums
  • Trades
  • News
  • Calendar
  • Market
  • Brokers
  • Login
  • Join
  • 12:27am
Sister Sites
  • Metals Mine
  • Energy EXCH
  • Crypto Craft

Options

Bookmark Thread

First Page First Unread Last Page Last Post

Print Thread

Similar Threads

All the Forecasting and Prediction indicators on the market? 18 replies

Economic Indicator Forecasting by Banks: Why and how 4 replies

Forecasting about currencies 9 replies

Anticipation vs. Forecasting 0 replies

Neral Networks to perform technical forecasting 0 replies

  • Trading Journals
  • /
  • Reply to Thread
  • Subscribe
  • 3,304
Attachments: Time and Price Forecasting
Exit Attachments

Time and Price Forecasting

  • Last Post
  •  
  • 1 139140Page 141142143 218
  • 1 Page 141 218
  •  
  • Post #2,801
  • Quote
  • Oct 30, 2020 4:31am Oct 30, 2020 4:31am
  •  LuckyPunk
  • | Joined Jun 2020 | Status: Member | 135 Posts
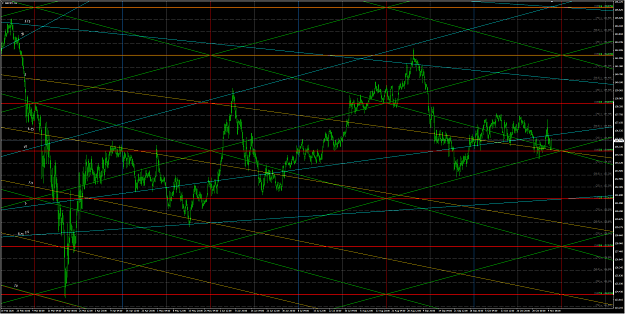
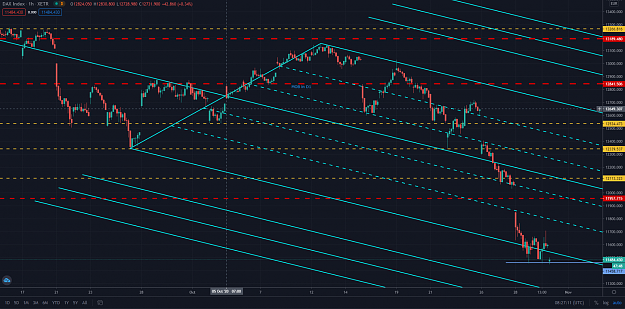
This is one it's also interest.. i like DAX but you need big cojones for this beast and lack that some times

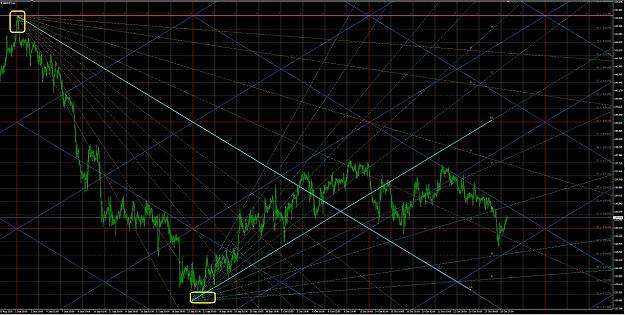
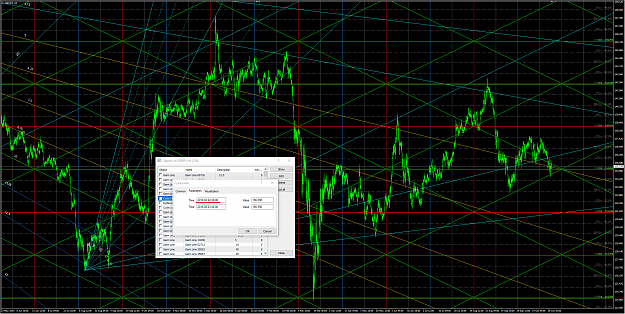
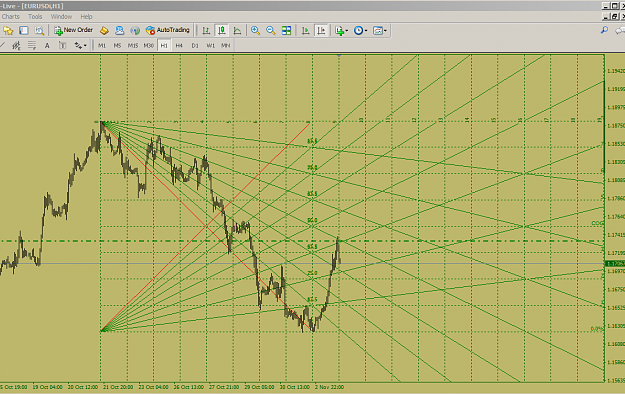
This DAX CASH so form 9am to 17:30 CET time, always big gaps but it still respects level like champ.. i find this amazing
Attached Image (click to enlarge)
Click to Enlarge

Name: 7831489c227ec29a570fd0ad7a7daa4d.png
Size: 342 KB
 
3
  • Post #2,802
  • Quote
  • Nov 1, 2020 3:48pm Nov 1, 2020 3:48pm
  •  parisboy
  • Joined Oct 2017 | Status: Member | 7,567 Posts
Quoting Swede
Disliked
{quote} You have done a marvelous job with your charts using Gann mt4 tools......I have a question? 1. Using the Gann tools with mt4 requires precision scaling because they overlay your chart...so if you inadvertently squeeze the chart, or change to another time period everything is completely out of wack. Is that why you trade mostly GJ, so it keeps all in place without altering so much? 2. The reason I use just fib tools almost exclusively is because they are based on levels and are placed on the chart, not overlayed. does not matter the...
Ignored
You do not really need "precision scaling" when you use a Mid Term or a Long Term chart

Precision Scaling is automatically generated by your software which takes into acount the Chart Low and the Chart Top

The Kwt4x chart is a 2 months chart

This means that as long as Price Action generates no new Top or no new Low the Chart "scaling " is stable.

Hence if you have to change the scaling, you just need to DOUBLE or HALVE the range parameters

Even on MT4 on a Long Term or a Mid Term chart you do not need to readapt / recalculate very often your tools (Angles, Gann Lines, Octaves , Circles, Ellipses, etc)
Attached Image (click to enlarge)
Click to Enlarge

Name: SCALING.jpg
Size: 196 KB
 
2
  • Post #2,803
  • Quote
  • Nov 1, 2020 9:27pm Nov 1, 2020 9:27pm
  •  Kwt4x
  • Joined Apr 2015 | Status: Member | 232 Posts
Quoting parisboy
Disliked
{quote} You do not really need "precision scaling" when you use a Mid Term or a Long Term chart Precision Scaling is automatically generated by your software which takes into acount the Chart Low and the Chart Top The Kwt4x chart is a 2 months chart This means that as long as Price Action generates no new Top or no new Low the Chart "scaling " is stable. Hence if you have to change the scaling, you just need to DOUBLE or HALVE the range parameters Even on MT4 on a Long Term or a Mid Term chart you do not need to readapt / recalculate very often...
Ignored
Agree.

you do not need scaling, you need to know mt4 flaws and workarounds.

tools that have 2 anchor points (most fib tools) they will be fixed even if you change timeframes.
tools that use 1 anchor point or use angles (GANN Line, Grid and Fib Arcs) they need to be used on 1 timeframe only(it need the exact time and price of the frame to get the correct angles).

GANN line and Grid, on the long run, will not stay in place when you move the vertical scale, the workaround for the line is to drag the ending point every now and then, the workaround for the grid is to move the vertical scale until the grid is inline with other fixed measurements then lock the "scale fix" of the chart.

knowing mt4 flaws and workarounds will make your measurements precise for the long/short term

my private trading chart since 2018 top might be a good example

Attached Image (click to enlarge)
Click to Enlarge

Name: ScreenHunter 2376.png
Size: 223 KB


cheers,
 
1
  • Post #2,804
  • Quote
  • Nov 2, 2020 12:19pm Nov 2, 2020 12:19pm
  •  Swede
  • Joined Mar 2009 | Status: Member | 2,151 Posts
Quoting Kwt4x
Disliked
{quote} Agree. you do not need scaling, you need to know mt4 flaws and workarounds. tools that have 2 anchor points (most fib tools) they will be fixed even if you change timeframes. tools that use 1 anchor point or use angles (GANN Line, Grid and Fib Arcs) they need to be used on 1 timeframe only(it need the exact time and price of the frame to get the correct angles). GANN line and Grid, on the long run, will not stay in place when you move the vertical scale, the workaround for the line is to drag the ending point every now and then, the workaround...
Ignored
My trading is more of a short term perspective...if I cant catch a level during NY then im not interested...but I have found with just this method I catch some really great entries...but of course I have all the majors running and gj ej....so it gets a bit much adjusting all the time, that is why I like the fib lines best...anyway, just my opinion...when I view your charts and parisboy entries It peaks my interest again...thanks for the reply
Attached Image (click to enlarge)
Click to Enlarge

Name: gj nov 2.png
Size: 80 KB
 
1
  • Post #2,805
  • Quote
  • Nov 2, 2020 12:32pm Nov 2, 2020 12:32pm
  •  Swede
  • Joined Mar 2009 | Status: Member | 2,151 Posts
Now I sometimes throw on becks emblem to see how it relates to the last swing...gives some pretty clear direction at least in the short term...
Attached Image (click to enlarge)
Click to Enlarge

Name: beck gj.png
Size: 91 KB
 
2
  • Post #2,806
  • Quote
  • Nov 2, 2020 12:41pm Nov 2, 2020 12:41pm
  •  LuckyPunk
  • | Joined Jun 2020 | Status: Member | 135 Posts
Quoting Swede
Disliked
Now I sometimes throw on becks emblem to see how it relates to the last swing...gives some pretty clear direction at least in the short term... {image}
Ignored
Swede, can you print screen you Indicator List used on the charts above?
 
 
  • Post #2,807
  • Quote
  • Nov 2, 2020 1:05pm Nov 2, 2020 1:05pm
  •  parisboy
  • Joined Oct 2017 | Status: Member | 7,567 Posts
GBPJPY 4 H
Attached Image (click to enlarge)
Click to Enlarge

Name: GBPJPY 4H 2 NOVEMBRE 2020.jpg
Size: 182 KB
 
2
  • Post #2,808
  • Quote
  • Nov 2, 2020 2:49pm Nov 2, 2020 2:49pm
  •  parisboy
  • Joined Oct 2017 | Status: Member | 7,567 Posts
GBPJPY 4 H

Gann Grid
Attached Image (click to enlarge)
Click to Enlarge

Name: GBPJPY GANN GRID 2 NOVEMBRE 2020.jpg
Size: 45 KB
 
1
  • Post #2,809
  • Quote
  • Nov 2, 2020 2:56pm Nov 2, 2020 2:56pm
  •  LuckyPunk
  • | Joined Jun 2020 | Status: Member | 135 Posts
i think GY as chance to reverse and go test 136.40..
Attached Image (click to enlarge)
Click to Enlarge

Name: 646a5f8fe1baa1e3cab7950a89e08f06.png
Size: 190 KB
 
 
  • Post #2,810
  • Quote
  • Nov 2, 2020 4:51pm Nov 2, 2020 4:51pm
  •  Shyna-b
  • | Joined Jan 2020 | Status: Member | 18 Posts
Many thanks to DM, Swede, Parisboy and all for sharing your knowledge to make us a better trader. Very much unlike me, I read every post from start to end. So also the Jenkins thread. Parisboy, I also use trading view for my analysis. So surprised to see how you placed the Gann grid. I have my box divided into four with the impulse wave representing the 4th angle in the grid according to Jenkins. I like your method and will try it. Please also share how you use the gann square because I have been unable to use it satisfactorily. I basically use ichimoku.
 
 
  • Post #2,811
  • Quote
  • Nov 2, 2020 11:06pm Nov 2, 2020 11:06pm
  •  Swede
  • Joined Mar 2009 | Status: Member | 2,151 Posts
Quoting LuckyPunk
Disliked
{quote} Swede, can you print screen you Indicator List used on the charts above?
Ignored
I like simplicity and found one of Ganns methods that suited my personality, risk profile and trading time zone, being NY.....its nothing fancy, but highly overlooked in my opinion, as I have been using it for some time now and its called Ganns rule of 1/8. I have taken it a few steps further than my research indicated, but we are trading a whole different ballgame in 2020 than back in Ganns day.

Anyway, its about Price, dividing a major swing by 8. it is also dividing the Time it took to reach a swing high to a swing low, also by 8. One now has a proper Grid to work with, not the grid standard on mt4. The next step is dividing the angles also by 8 and placing them over the swing low, and the swing high for some very very accurate trading points. Seldom do I use more than a 20 pip stop during peak periods, seldom take trade during ranging slow periods.

You will find the three Fibonacci drawings under your insert tab.
Attached Images (click to enlarge)
Click to Enlarge

Name: gann one eight.png
Size: 39 KB Click to Enlarge

Name: 1.png
Size: 27 KB Click to Enlarge

Name: closed with 200 pips.png
Size: 77 KB
 
3
  • Post #2,812
  • Quote
  • Nov 3, 2020 3:59am Nov 3, 2020 3:59am
  •  LuckyPunk
  • | Joined Jun 2020 | Status: Member | 135 Posts
Quoting Swede
Disliked
{quote} I like simplicity and found one of Ganns methods that suited my personality, risk profile and trading time zone, being NY.....its nothing fancy, but highly overlooked in my opinion, as I have been using it for some time now and its called Ganns rule of 1/8. I have taken it a few steps further than my research indicated, but we are trading a whole different ballgame in 2020 than back in Ganns day. Anyway, its about Price, dividing a major swing by 8. it is also dividing the Time it took to reach a swing high to a swing low, also by 8. One...
Ignored

Thanks Swede! much appreciated for detailed explanation..
I'm also starting to read the P. Mikula.. he was the Game Changer in my Pitchfork's trading..
 
1
  • Post #2,813
  • Quote
  • Nov 3, 2020 10:42am Nov 3, 2020 10:42am
  •  Swede
  • Joined Mar 2009 | Status: Member | 2,151 Posts
Quoting LuckyPunk
Disliked
{quote} Thanks Swede! much appreciated for detailed explanation.. I'm also starting to read the P. Mikula.. he was the Game Changer in my Pitchfork's trading..
Ignored
Now, I do use other tools for confluence...ADR is very telling on a spike like today, also weekly pivots are on one of my background charts which also adds to my reason to pull the trigger sometimes....but today was just the 1/8 resistance to the downside which got me into the trade , at least smaller lots until I see more confirmation....
Attached Image (click to enlarge)
Click to Enlarge

Name: other tools.png
Size: 80 KB
 
 
  • Post #2,814
  • Quote
  • Nov 3, 2020 1:04pm Nov 3, 2020 1:04pm
  •  Swede
  • Joined Mar 2009 | Status: Member | 2,151 Posts
if you were following this, we are up nearly 80 pips at this point in an hour....I had added 2 more mini lots as it tried to go higher, knowing between the fib angles, the adr breach, the seeming oversold condition, and the overall direction, might bank a bit, we shall see..
Attached Image (click to enlarge)
Click to Enlarge

Name: up 80.png
Size: 77 KB
 
 
  • Post #2,815
  • Quote
  • Nov 3, 2020 1:23pm Nov 3, 2020 1:23pm
  •  Swede
  • Joined Mar 2009 | Status: Member | 2,151 Posts
final post today....and Euro up 30 time 2 lots...very nice day all done in about 1 hour and 45 min....this trade was simply taken at the cross...with trend
Attached Image (click to enlarge)
Click to Enlarge

Name: euro up 30 times 2.png
Size: 70 KB
 
1
  • Post #2,816
  • Quote
  • Nov 3, 2020 1:28pm Nov 3, 2020 1:28pm
  •  LuckyPunk
  • | Joined Jun 2020 | Status: Member | 135 Posts
Quoting Swede
Disliked
{quote} Now, I do use other tools for confluence...ADR is very telling on a spike like today, also weekly pivots are on one of my background charts which also adds to my reason to pull the trigger sometimes....but today was just the 1/8 resistance to the downside which got me into the trade , at least smaller lots until I see more confirmation.... {image}
Ignored
Good point with ADR need to look into that.. and use i week/month pivot also... its all about convergences of "reasons" in small price area. I always i have the saying form Bryce Gilmore "it's betters two reasons than one to open trade"
GY has now up Fork and already bounced on ML..
Attached Image (click to enlarge)
Click to Enlarge

Name: 56d59e26af720ef62dd53de27d3f7d5d.png
Size: 213 KB
 
1
  • Post #2,817
  • Quote
  • Nov 5, 2020 2:48am Nov 5, 2020 2:48am
  •  Kwt4x
  • Joined Apr 2015 | Status: Member | 232 Posts
Attached Image (click to enlarge)
Click to Enlarge

Name: gann one eight.png
Size: 39 KB


Attached Image (click to enlarge)
Click to Enlarge

Name: ScreenHunter 2392.png
Size: 173 KB


Attached Image (click to enlarge)
Click to Enlarge

Name: ScreenHunter 2391.png
Size: 237 KB
 
1
  • Post #2,818
  • Quote
  • Nov 6, 2020 12:31am Nov 6, 2020 12:31am
  •  Pnaveen
  • | Joined Apr 2019 | Status: Member | 89 Posts
Quoting Pnaveen
Disliked
EURUSD YESTERDAY SHORT AGAIN{image}{image}
Ignored
EURUSD DATES PERFECTLY MATCHED..
Attached Image (click to enlarge)
Click to Enlarge

Name: EURUSDDaily.png
Size: 131 KB
 
 
  • Post #2,819
  • Quote
  • Nov 6, 2020 6:08am Nov 6, 2020 6:08am
  •  parisboy
  • Joined Oct 2017 | Status: Member | 7,567 Posts
Quoting Kwt4x
Disliked
{image} {image} {image}
Ignored
Your charts have zero interest for trading . More you draw horizontal, diagonal, vertical lines, plus circles, ellipses triangles etc more these spaghetti charts are unexploitable and confusing.

But your charts have an interest for demonstration and teaching.

Your charts shows

a) complexity is in your brain only you produced such charts because you BELIEVE that accumulating Lines and Indicators would give you a BETTER understanding, CONFLUENCE and CONFIRMATION

Have vou ever checked if it is TRUE and EFFICIENT ?

b) Your chart revisited shows :

- what "lines" are really important
- no computer can decide at your place what pattern is important and what is not only your BRAIN
- there is no substitute to your BRAIN

That is the real lesson your chart demonstrates. Thank you.

Moreover there is no "complexity" in Gann work and tools.

"Complexity" is in your brain only. If your brain is attracted by "complexity" you will produce "complex" charts, methodologies, tools.

Technical Analysis marketeers LOVE "complexity" because they are real "traders" : they trade expensive courses, softwares, webinars, books, trading rooms chats etc against your money.
Attached Images (click to enlarge)
Click to Enlarge

Name: KWT4X ScreenHunter 2392.png
Size: 173 KB Click to Enlarge

Name: KWT4X CHART REVISITED.jpg
Size: 191 KB
 
1
  • Post #2,820
  • Quote
  • Nov 6, 2020 6:18am Nov 6, 2020 6:18am
  •  parisboy
  • Joined Oct 2017 | Status: Member | 7,567 Posts
What shows us KWT4X chart (revisited)

- a Channel - hence a Trend
- SineWaves
- Cycles (or Waves)
- a Pitchfork
- a Return to the Mean
- an Uptrending Underlying Trend
Attached Image (click to enlarge)
Click to Enlarge

Name: KWT4X CHART REVISITED.jpg
Size: 191 KB
 
1
  • Trading Journals
  • /
  • Time and Price Forecasting
  • Reply to Thread
    • 1 139140Page 141142143 218
    • 1 Page 141 218
0 traders viewing now
  • More
Top of Page
Forex Factory Blog Updated: Alerting All Members
  • Facebook
  • Twitter
About FF
  • Mission
  • Products
  • User Guide
  • Media Kit
  • Blog
  • Contact
FF Products
  • Forums
  • Trades
  • Calendar
  • News
  • Market
  • Brokers
  • Trade Explorer
FF Website
  • Homepage
  • Search
  • Members
  • Report a Bug
Follow FF
  • Facebook
  • Twitter

FF Sister Sites:

  • Metals Mine
  • Energy EXCH
  • Crypto Craft

Forex Factory® is a brand of Fair Economy, Inc.

Terms of Service / ©2022